UNITED STATES
SECURITIES AND EXCHANGE COMMISSION
WASHINGTON, D.C. 20549
Form 6-K
REPORT OF FOREIGN PRIVATE ISSUER
PURSUANT TO RULE 13a-16 OR 15d-16
OF THE SECURITIES EXCHANGE ACT OF 1934
For the month of February 2026
Commission File Number 1-14840
AMDOCS LIMITED
Hirzel House, Smith Street,
St. Peter Port, Island of Guernsey, GY1 2NG
Amdocs, Inc.
625 Maryville Centre Drive, Suite 200, Saint Louis, Missouri 63141
(Address of principal executive offices)
Indicate by check mark whether the registrant files or will file annual reports under cover of Form 20-F or Form 40-F:
FORM 20-F ☒ FORM 40-F ☐
On February 3, 2026 Amdocs Limited (“Amdocs”) issued a press release announcing financial results for the quarter ended December 31, 2025. A copy of the press release and the accompanying presentation are furnished as Exhibits 99.1 and 99.2 to this Report of Foreign Private Issuer on Form 6-K.
The information in this Form 6-K (including Exhibits 99.1 and 99.2) shall not be deemed “filed” for purposes of Section 18 of the Securities Exchange Act of 1934 (the “Exchange Act”) or otherwise subject to the liabilities of that section, nor shall it be deemed incorporated by reference in any filing under the Securities Act of 1933 or the Exchange Act.
EXHIBIT INDEX
| EXHIBIT NO. |
DESCRIPTION | |
| 99.1 | Amdocs Limited Press Release Announcing Q1 Earnings, dated February 3, 2026 | |
| 99.2 | Fiscal Q1 2026 Earnings Presentation | |
SIGNATURES
Pursuant to the requirements of the Securities Exchange Act of 1934, the registrant has duly caused this report to be signed on its behalf by the undersigned, thereunto duly authorized.
| AMDOCS LIMITED | ||
| By: | /s/ Matthew E. Smith | |
| Matthew E. Smith | ||
| Secretary and Authorized Signatory | ||
Date: February 3, 2026

|
Exhibit 99.1 | |
|
|

Amdocs Limited Reports First Quarter Fiscal 2026 Results
Revenue of $1.16 Billion, up 4.1% YoY as Reported and up 3.5% YoY in Constant Currency(1)
T-Mobile USA, Inc. Enters into a Strategic Multi-Year Agreement with Amdocs to Support
Its Customer Experience and Operational Excellence Journey
Amdocs Introduces aOS: An Agentic Operating System for Telecommunications
Expects Fiscal 2026 Revenue Growth Outlook of 1.5%-5.5% YoY as Reported
Reiterates Fiscal 2026 Revenue Growth Outlook of 1.0%-5.0% YoY in Constant Currency(1)
First Quarter Fiscal 2026 Highlights
(All comparisons are against the prior year)
| • | Revenue of $1,156 million, up 4.1% as reported and up 3.5% in constant currency(1); revenue was above the midpoint of the $1,135-$1,175 million guidance range even with unfavorable foreign currency movements of roughly $3 million compared to our guidance assumptions |
| • | Revenue of $182 million in Europe, up 17.1% as compared to last year’s first quarter |
| • | Managed services revenue of $746 million, equivalent to approximately 65% of total revenue and up 2.3% as compared to last year’s first quarter |
| • | GAAP diluted EPS of $1.45, above the $1.36-$1.44 guidance range, primarily due to a lower than anticipated GAAP effective tax rate |
| • | Non-GAAP diluted EPS of $1.81, above the guidance range of $1.73-$1.79, primarily due to a lower than anticipated non-GAAP effective tax rate |
| • | GAAP operating income of $207 million; GAAP operating margin of 17.9%, up 640 basis points sequentially, mainly due to lower restructuring charges, and unchanged compared to last year’s first quarter |
| (1) | Revenue on a constant currency basis assumes exchange rates in the current period were unchanged from the prior period |
| (2) | Please refer to the Selected Financial Metrics tables below (figures may not sum because of rounding) |
| (3) | Expected total shareholder return assumes midpoint of fiscal year 2026 non-GAAP EPS growth outlook, plus dividend yield |
| • | Non-GAAP operating income of $250 million; non-GAAP operating margin of 21.6%, up 40 basis points as compared to last year’s first fiscal quarter and unchanged sequentially |
| • | Free cash flow of $188 million, comprised of cash flow from operations of $220 million, less $32 million in net capital expenditures(2), including $49 million of restructuring payments; reiterates full year fiscal 2026 free cash outlook of $710 million to $730 million, excluding restructuring payments |
| • | Repurchased $146 million of ordinary shares during the first fiscal quarter |
| • | Twelve-month backlog of $4.25 billion, up approximately $60 million sequentially and up 2.7% as compared to last year’s first fiscal quarter |
JERSEY CITY, NJ – February 3, 2026 – Amdocs Limited (NASDAQ: DOX), a leading provider of software and services to communications and media companies, today reported operating results for the three months ended December 31, 2025.
“First quarter financial results were consistent with our guidance as we continue to focus on our primary goal of reaccelerating Amdocs’ long-term growth and extending our position as a market leader for the generative AI era. I am proud to announce that Amdocs has extended our long-term relationship with T-Mobile under a new multi-year agreement which includes managed services, software development, and AI innovation. In addition, we signed an expanded multi-year engagement at Vodafone Germany, added two new western European logos, and closed the acquisition of Matrixx Software as a strategic consolidation move which complements and expands our activities at Verizon, Telus, Telefonica, Swisscom, Three, Virgin Media O2, Telstra and other customers. As to generative AI, our accelerated development roadmap is progressing as planned with today’s announcement of aOS, an agentic operating system purpose-built for telecommunications which we expect can provide a new long-term growth engine for Amdocs,” said Shuky Sheffer, president and chief executive officer of Amdocs Management Limited.
“Our first quarter profitability improved significantly from a year ago and was unchanged sequentially as we balanced internal efficiency gains with accelerated generative AI investments. Earnings-to-cash conversion was strong, reflecting consistent execution under the many milestone and outcome-based projects and managed services engagements we are supporting for our customers. Over the busy holiday period, we provided best-in-class mission critical operations support for our customers. We also maintained very high managed services renewal rates, signing expanded multi-year engagements with T-Mobile, Vodafone Germany and other customers which together strengthen our business resiliency, said Tamar Rapaport-Dagim, chief financial officer & chief operating officer of Amdocs Management Limited.
Sheffer concluded, “Across our serviceable addressable market of roughly $60 billion, many growth opportunities exist by expanding our value proposition with current customers, diversifying in new geographies and by addressing emerging domains such as Generative AI, cloud migration and fiber rollout. With our deep telco domain expertise and tech-led, outcomes-based business model, we are strongly positioned to monetize a rich deal pipeline. That said, we continue to monitor our customers’ demand and spending behavior within the global macroeconomic environment. Overall, we are reiterating our fiscal 2026 revenue growth outlook of 1.0% to 5.0% in constant currency(1), putting us on-track to achieve our target of high single-digit expected total shareholder returns(3) for the year.”
Revenue
(All comparisons are against the prior year period)
| In millions Three months ended December 31, 2025 |
||||||||
| Actual | Guidance | |||||||
| Revenue |
$ | 1,156 | $ | 1,135 - $1,175 | ||||
| Revenue Growth, as reported |
4.1 | % | ||||||
| Revenue Growth, constant currency (1) |
3.5 | % | ||||||
| • |
|
| • | Revenue for the first fiscal quarter includes a positive impact from foreign currency movements of approximately $7 million relative to the first quarter of fiscal 2025 and a negative impact from foreign currency movements of approximately $3 million relative to the fourth quarter of fiscal 2025 and compared to our guidance assumptions |
Net Income and Earnings Per Share
| In thousands, except per share data Three months ended December 31, |
||||||||
| 2025 | 2024 | |||||||
| GAAP Measures |
||||||||
| Net Income |
$ | 158,454 | $ | 151,852 | ||||
| Net Income attributable to Amdocs Limited |
$ | 157,566 | $ | 151,133 | ||||
| Diluted earnings per share |
$ | 1.45 | $ | 1.33 | ||||
| Non-GAAP Measures |
||||||||
| Non-GAAP Net Income |
$ | 197,131 | $ | 188,877 | ||||
| Non-GAAP Net Income attributable to Amdocs Limited |
$ | 196,243 | $ | 188,158 | ||||
| Non-GAAP Diluted earnings per share |
$ | 1.81 | $ | 1.66 | ||||
| • | Non-GAAP net income excludes amortization of purchased intangible assets and other acquisition-related costs, changes in certain acquisition related liabilities measured at fair value, equity-based compensation expenses, restructuring charges, and other, net of related tax effects. For further details of the reconciliation of selected financial metrics from GAAP to Non-GAAP, please refer to the tables below. |
Capital Allocation
| • | M&A Activity: On December 23, 2025, Amdocs completed the acquisition of Matrixx, a privately owned company specializing in Charging & Rating solutions for global communication service providers, for a net consideration of approximately $197 million |
| • | Quarterly Cash Dividend Program: On February 3, 2026, the Board approved the Company’s next quarterly cash dividend payment at the new increased rate of $0.569 per share, as approved at the January 2026 annual general meeting of shareholders and set March 31, 2026 as the record date for determining the shareholders entitled to receive the dividend, which will be payable on April 24, 2026 |
| • | Share Repurchase Activity: Repurchased $146 million of ordinary shares during the first quarter of fiscal 2026 |
Twelve-month Backlog
Twelve-month backlog was $4.25 billion at the end of the first quarter of fiscal 2026, up approximately 2.7% as compared to last year’s first fiscal quarter. Twelve-month backlog includes anticipated revenue related to contracts, estimated revenue from managed services contracts, letters of intent, maintenance and estimated on-going support activities.
Second Quarter Fiscal 2026 Outlook
| In millions, except per share data | ||
| Q2 - 2026 | ||
| Revenue |
$1,150-$1,190 | |
| GAAP Diluted earnings per share |
$1.22-$1.30 | |
| Non-GAAP Diluted earnings per share |
$1.73-$1.79 |
| • | Second quarter revenue guidance assumes a positive $1 million sequential impact from foreign currency fluctuations as compared to the first quarter of fiscal 2026 |
| • | Second quarter non-GAAP diluted EPS guidance excludes primarily equity-based compensation expense of approximately $0.33-$0.35 per share, amortization of purchased intangible assets and other acquisition-related costs of approximately $0.15 per share, changes in certain acquisitions related liabilities measured at fair value, and other, net of related tax effects |
| • | GAAP diluted EPS guidance does not include the impact of future restructuring charges |
Full Year Fiscal 2026 Outlook
| FY 2026 - Year-over -Year growth | ||||
| Current guidance | Previous guidance | |||
| Revenue Growth, as reported |
1.5%-5.5% | 1.7%-5.7% | ||
| Revenue Growth, constant currency (1) |
1.0%-5.0% | 1.0%-5.0% | ||
| GAAP Diluted earnings per share |
10.0%-17.0% | 13.5%-20.5% | ||
| Non-GAAP Diluted earnings per share |
4.0%-8.0% | 4.0%-8.0% | ||
| FY 2026, in millions | ||||
| Current guidance | Previous guidance | |||
| Free Cash Flow (2) |
$710-$730 | $710-$730 | ||
| • | Full year fiscal 2026 revenue guidance incorporates an expected positive impact from foreign currency fluctuations of approximately 0.5% year-over-year compared with a positive impact of 0.7% year-over-year previously, and includes some inorganic contribution, including the acquisition of Matrixx Software which was already contemplated in the full year revenue guidance |
| • | GAAP diluted EPS guidance does not include the impact of future restructuring charges |
| • | Non-GAAP diluted earnings per share growth excludes primarily equity-based compensation expense of approximately $0.98-$1.04 per share, amortization of purchased intangible assets and other acquisition-related costs of approximately $0.55 per share, changes in certain acquisitions related liabilities measured at fair value, and other, net of related tax effects |
| • | Non-GAAP operating margin is anticipated to be within a range of 21.3% to 21.9% for the full year fiscal 2026 |
| • | Non-GAAP operating margin is comprised of GAAP operating margin, excluding amortization of purchased intangible assets and other, equity-based compensation expense, restructuring charges, and changes in certain acquisitions related liabilities measured at fair value |
| • | Non-GAAP effective tax rate is anticipated to be within a range of 16% to 19% for the full year fiscal 2026 |
| • | Reiterates full year fiscal 2026 free cash flow(2) of $710 million to $730 million, excluding payments related to restructuring charges; free cash flow(2) is comprised of cash flow from operations, less net capital expenditures |
The forward-looking statements regarding our second fiscal quarter 2026 and full year fiscal 2026 guidance take into consideration the Company’s current expectations regarding macro and industry specific risks and various uncertainties and certain assumptions that we will discuss on our earnings conference call. However, we note that market dynamics continue to shift rapidly and we cannot predict all possible outcomes, including those resulting from certain geopolitical events, the current inflationary environment, changes to trade policies including tariffs and trade restrictions and the resulting impact on economic activities (as our outlook assumes current economic conditions do not deteriorate significantly due to trade policy or other macro factors), global or regional events, and the prevailing level of macro-economic, business and operational uncertainty, which have created, and continue to create, a significant amount of uncertainty, or from current and potential customer consolidation or their other strategic corporate activities.
Conference Call and Earnings Webcast Presentation Details
Amdocs will host a conference call and earnings webcast presentation on February 3, 2026 at 5:00 p.m. Eastern Time to discuss the Company’s first quarter of fiscal 2026 results. To participate in the call, please register here to receive the dial-in numbers and unique access PIN. The conference call and webcast will also be carried live on the Internet and may be accessed via the Amdocs website at https://investors.amdocs.com. Presentation slides will be available shortly before the webcast.
Non-GAAP Financial Measures
This release includes non-GAAP diluted earnings per share and other non-GAAP financial measures, including free cash flow(2), revenue on a constant currency(1) basis, non-GAAP cost of revenue, non-GAAP research and development, non-GAAP selling, general and administrative, non-GAAP operating income, non-GAAP operating margin, non-GAAP interest and other expenses, net, non-GAAP income taxes, non-GAAP effective tax rate, non-GAAP net income, non-GAAP net income attributable to Amdocs Limited and non-GAAP diluted earnings per share growth. These other non-GAAP measures exclude the following items:
| • | amortization of purchased intangible assets and other acquisition-related costs; |
| • | changes in certain acquisition-related liabilities measured at fair value; |
| • | restructuring and unusual charges or benefits; |
| • | equity-based compensation expense; |
| • | other; and |
| • | tax effects related to the above. |
Free cash flow(2) equals cash generated by operating activities less net capital expenditures. These non-GAAP financial measures are not in accordance with, or an alternative for, generally accepted accounting principles and may be different from non-GAAP financial measures used by other companies. In addition, these non-GAAP financial measures are not based on any comprehensive set of accounting rules or principles. Amdocs believes that non-GAAP financial measures have limitations in that they do not reflect all of the amounts associated with Amdocs’ results of operations as determined in accordance with GAAP and that these measures should only be used to evaluate Amdocs’ results of operations in conjunction with the corresponding GAAP measures.
Amdocs believes that the presentation of non-GAAP diluted earnings per share and other financial measures, including free cash flow(2), revenue on a constant currency(1) basis, non-GAAP cost of revenue, non-GAAP research and development, non-GAAP selling, general and administrative, non-GAAP operating income, non-GAAP operating margin, non-GAAP interest and other expenses, net, non-GAAP income taxes, non-GAAP effective tax rate, non-GAAP net income, non-GAAP net income attributable to Amdocs Limited and non-GAAP diluted earnings per share growth when shown in conjunction with the
corresponding GAAP measures, provides useful information to investors and management regarding financial and business trends relating to its financial condition and results of operations, as well as the net amount of cash generated by its business operations after taking into account capital spending required to maintain or expand the business.
For its internal budgeting process and in monitoring the results of the business, Amdocs’ management uses financial statements that do not include amortization of purchased intangible assets and other acquisition-related costs, changes in certain acquisition-related liabilities measured at fair value, restructuring and unusual charges or benefits, equity-based compensation expense, other and related tax effects. Amdocs’ management also uses the foregoing non-GAAP financial measures, in addition to the corresponding GAAP measures, in reviewing the financial results of Amdocs. In addition, Amdocs believes that significant groups of investors exclude these items in reviewing its results and those of its competitors, because the amounts of the items between companies can vary greatly depending on the assumptions used by an individual company in determining the amounts of the items.
Amdocs further believes that, where the adjustments used in calculating non-GAAP diluted earnings per share are based on specific, identified amounts that impact different line items in the Consolidated Statements of Income (including cost of revenue, research and development, selling, general and administrative, operating income, interest and other expenses, net, income taxes and net income), it is useful to investors to understand how these specific line items in the Consolidated Statements of Income are affected by these adjustments. Please refer to the Reconciliation of Selected Financial Metrics from GAAP to Non-GAAP tables below.
Supporting Resources
| • | Keep up with Amdocs news by visiting the Company’s website |
| • | Subscribe to Amdocs’ RSS Feed and follow us on Twitter, Facebook, LinkedIn and YouTube |
About Amdocs
Amdocs helps the world’s leading communications and media companies deliver exceptional customer experiences through reliable, efficient, and secure operations at scale. We provide software products and services that embed intelligence into how work runs across business, IT, and network domains – delivering measurable outcomes in customer experience, network performance, cloud modernization, and revenue growth. With our talented people, and more than 40 years of experience running mission-critical systems around the globe, Amdocs runs billions of transactions daily. Our technology is relied on every day, connecting people worldwide and advancing a more inclusive, connected world. Together, we help those who shape the future to make it amazing. Amdocs is listed on the NASDAQ Global Select Market (NASDAQ: DOX) and reported revenue of $4.53 billion in fiscal 2025. For more information, visit www.amdocs.com.
This press release includes information that constitutes forward-looking statements made pursuant to the safe harbor provision of the Private Securities Litigation Reform Act of 1995, including statements about Amdocs’ growth and business results in future quarters and years. Although we believe the expectations reflected in such forward-looking statements are based upon reasonable assumptions, we can give no assurance that our expectations will be obtained or that any deviations will not be material. Such statements involve risks and uncertainties that may cause future results to differ from those anticipated. These risks include, but are not limited to, the effects of general macroeconomic conditions, prevailing level of macroeconomic, business and operational uncertainty, including as a result of geopolitical events or other regional events or pandemics, changes to trade policies including tariffs and trade restrictions, as well as the current inflationary environment, and the effects of these conditions on the Company’s customers’ businesses and levels of business activity, including the effect of the current economic uncertainty and industry pressure on the spending decisions of the Company’s customers. Amdocs’ ability to grow in the business markets that it serves, Amdocs’ ability to successfully integrate acquired businesses, adverse effects of market competition, rapid technological shifts that may render the Company’s products and services obsolete, security incidents, including breaches and cyberattacks to our systems and networks and those of our partners or
customers, potential loss of a major customer, our ability to develop long-term relationships with our customers, our ability to successfully and effectively implement artificial intelligence and Generative AI in the Company’s offerings and operations, and risks associated with operating businesses in the international market. Amdocs may elect to update these forward-looking statements at some point in the future; however, Amdocs specifically disclaims any obligation to do so. These and other risks are discussed at greater length in Amdocs’ filings with the Securities and Exchange Commission, including in our Annual Report on Form 20-F for the fiscal year ended September 30, 2025, filed on December 15, 2025.
Contact:
Matthew Smith
Head of Investor Relations
Amdocs
314-212-8328
E-mail: dox_info@amdocs.com
AMDOCS LIMITED
Consolidated Statements of Income
(In thousands, except per share data)
| Three months ended December 31, |
||||||||
| 2025 | 2024 | |||||||
| Revenue |
$ | 1,155,939 | $ | 1,110,055 | ||||
| Operating expenses: |
||||||||
| Cost of revenue |
727,723 | 682,259 | ||||||
| Research and development |
81,978 | 84,333 | ||||||
| Selling, general and administrative |
113,721 | 122,087 | ||||||
| Amortization of purchased intangible assets and other |
14,534 | 15,759 | ||||||
| Restructuring charges |
11,301 | 6,783 | ||||||
|
|
|
|
|
|||||
| 949,257 | 911,221 | |||||||
|
|
|
|
|
|||||
| Operating income |
206,682 | 198,834 | ||||||
| Interest and other expense, net |
(11,265 | ) | (6,409 | ) | ||||
|
|
|
|
|
|||||
| Income before income taxes |
195,417 | 192,425 | ||||||
|
|
|
|
|
|||||
| Income taxes |
36,963 | 40,573 | ||||||
|
|
|
|
|
|||||
| Net income |
$ | 158,454 | $ | 151,852 | ||||
|
|
|
|
|
|||||
| Net income attributable to noncontrolling interests |
888 | 719 | ||||||
|
|
|
|
|
|||||
| Net income attributable to Amdocs Limited |
$ | 157,566 | $ | 151,133 | ||||
|
|
|
|
|
|||||
| Basic earnings per share attributable to Amdocs Limited |
$ | 1.46 | $ | 1.34 | ||||
|
|
|
|
|
|||||
| Diluted earnings per share attributable to Amdocs Limited |
$ | 1.45 | $ | 1.33 | ||||
|
|
|
|
|
|||||
| Cash dividends declared per ordinary share |
$ | 0.527 | $ | 0.479 | ||||
|
|
|
|
|
|||||
| Basic weighted average number of shares outstanding |
107,977 | 112,745 | ||||||
|
|
|
|
|
|||||
| Diluted weighted average number of shares outstanding |
108,512 | 113,439 | ||||||
|
|
|
|
|
|||||
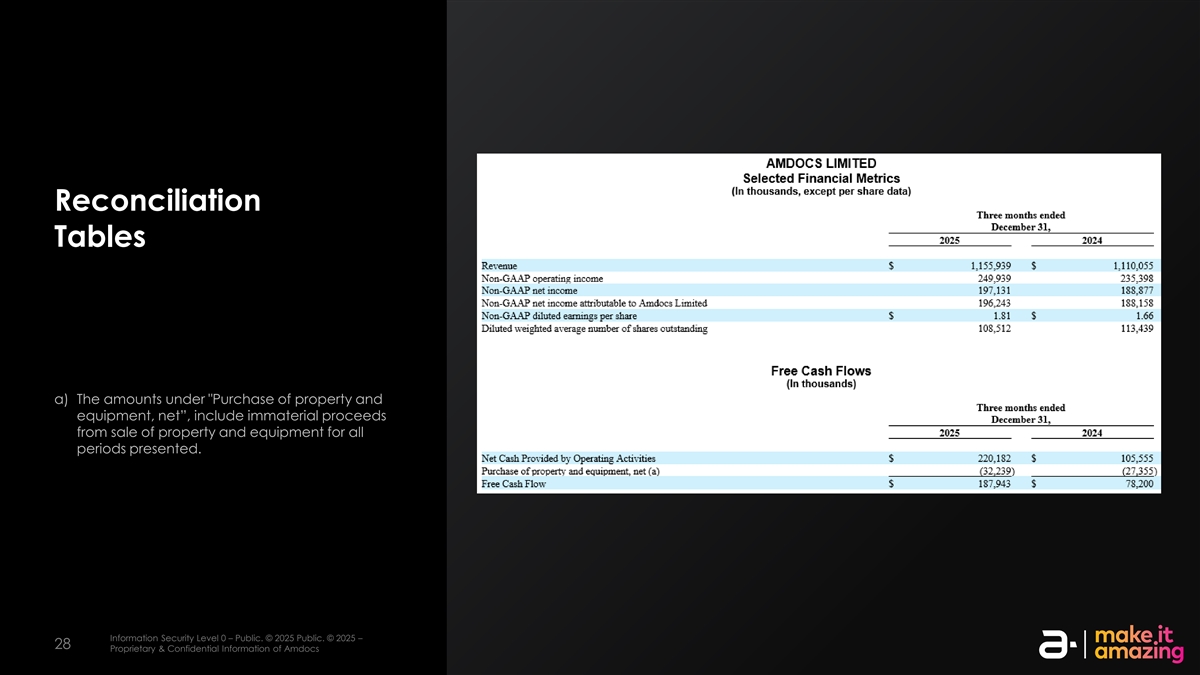
AMDOCS LIMITED
Selected Financial Metrics
(In thousands, except per share data)
| Three months ended December 31, |
||||||||
| 2025 | 2024 | |||||||
| Revenue |
$ | 1,155,939 | $ | 1,110,055 | ||||
| Non-GAAP operating income |
249,939 | 235,398 | ||||||
| Non-GAAP net income |
197,131 | 188,877 | ||||||
| Non-GAAP net income attributable to Amdocs Limited |
196,243 | 188,158 | ||||||
| Non-GAAP diluted earnings per share |
$ | 1.81 | $ | 1.66 | ||||
| Diluted weighted average number of shares outstanding |
108,512 | 113,439 | ||||||
Free Cash Flows
(In thousands)
| Three months ended December 31, |
||||||||
| 2025 | 2024 | |||||||
| Net Cash Provided by Operating Activities |
$ | 220,182 | $ | 105,555 | ||||
| Purchase of property and equipment, net (a) |
(32,239 | ) | (27,355 | ) | ||||
|
|
|
|
|
|||||
| Free Cash Flow |
$ | 187,943 | $ | 78,200 | ||||
| (a) | The amounts under “Purchase of property and equipment, net”, include immaterial proceeds from sale of property and equipment for all periods presented. |
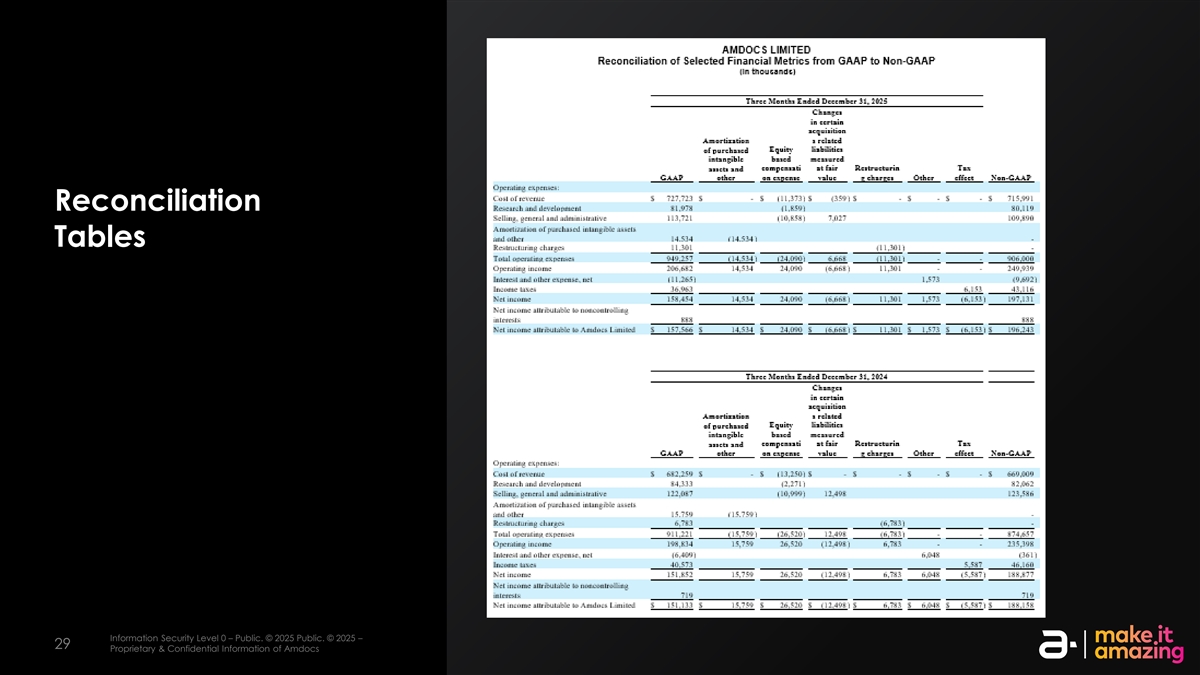
AMDOCS LIMITED
Reconciliation of Selected Financial Metrics from GAAP to Non-GAAP
(In thousands)
| Three Months Ended December 31, 2025 | ||||||||||||||||||||||||||||||||
| GAAP | Amortization of purchased intangible assets and other |
Equity based compensation expense |
Changes in certain acquisitions related liabilities measured at fair value |
Restructuring charges |
Other | Tax effect |
Non-GAAP | |||||||||||||||||||||||||
| Operating expenses: |
||||||||||||||||||||||||||||||||
| Cost of revenue |
$ | 727,723 | $ | — | $ | (11,373 | ) | $ | (359 | ) | $ | — | $ | — | $ | — | $ | 715,991 | ||||||||||||||
| Research and development |
81,978 | (1,859 | ) | 80,119 | ||||||||||||||||||||||||||||
| Selling, general and administrative |
113,721 | (10,858 | ) | 7,027 | 109,890 | |||||||||||||||||||||||||||
| Amortization of purchased intangible assets and other |
14,534 | (14,534 | ) | — | ||||||||||||||||||||||||||||
| Restructuring charges |
11,301 | (11,301 | ) | — | ||||||||||||||||||||||||||||
|
|
|
|
|
|
|
|
|
|
|
|
|
|
|
|
|
|||||||||||||||||
| Total operating expenses |
949,257 | (14,534 | ) | (24,090 | ) | 6,668 | (11,301 | ) | — | — | 906,000 | |||||||||||||||||||||
|
|
|
|
|
|
|
|
|
|
|
|
|
|
|
|
|
|||||||||||||||||
| Operating income |
206,682 | 14,534 | 24,090 | (6,668 | ) | 11,301 | — | — | 249,939 | |||||||||||||||||||||||
| Interest and other expense, net |
(11,265 | ) | 1,573 | (9,692 | ) | |||||||||||||||||||||||||||
| Income taxes |
36,963 | 6,153 | 43,116 | |||||||||||||||||||||||||||||
|
|
|
|
|
|
|
|
|
|
|
|
|
|
|
|
|
|||||||||||||||||
| Net income |
158,454 | 14,534 | 24,090 | (6,668 | ) | 11,301 | 1,573 | (6,153 | ) | 197,131 | ||||||||||||||||||||||
|
|
|
|
|
|
|
|
|
|
|
|
|
|
|
|
|
|||||||||||||||||
| Net income attributable to noncontrolling interests |
888 | 888 | ||||||||||||||||||||||||||||||
|
|
|
|
|
|
|
|
|
|
|
|
|
|
|
|
|
|||||||||||||||||
| Net income attributable to Amdocs Limited |
$ | 157,566 | $ | 14,534 | $ | 24,090 | $ | (6,668 | ) | $ | 11,301 | $ | 1,573 | $ | (6,153 | ) | $ | 196,243 | ||||||||||||||
|
|
|
|
|
|
|
|
|
|
|
|
|
|
|
|
|
|||||||||||||||||
| Three Months Ended December 31, 2024 | ||||||||||||||||||||||||||||||||
| GAAP | Amortization of purchased intangible assets and other |
Equity based compensation expense |
Changes in certain acquisitions related liabilities measured at fair value |
Restructuring charges |
Other | Tax effect |
Non-GAAP | |||||||||||||||||||||||||
| Operating expenses: |
||||||||||||||||||||||||||||||||
| Cost of revenue |
$ | 682,259 | $ | — | $ | (13,250 | ) | $ | — | $ | — | $ | — | $ | — | $ | 669,009 | |||||||||||||||
| Research and development |
84,333 | (2,271 | ) | 82,062 | ||||||||||||||||||||||||||||
| Selling, general and administrative |
122,087 | (10,999 | ) | 12,498 | 123,586 | |||||||||||||||||||||||||||
| Amortization of purchased intangible assets and other |
15,759 | (15,759 | ) | — | ||||||||||||||||||||||||||||
| Restructuring charges |
6,783 | (6,783 | ) | — | ||||||||||||||||||||||||||||
|
|
|
|
|
|
|
|
|
|
|
|
|
|
|
|
|
|||||||||||||||||
| Total operating expenses |
911,221 | (15,759 | ) | (26,520 | ) | 12,498 | (6,783 | ) | — | — | 874,657 | |||||||||||||||||||||
|
|
|
|
|
|
|
|
|
|
|
|
|
|
|
|
|
|||||||||||||||||
| Operating income |
198,834 | 15,759 | 26,520 | (12,498 | ) | 6,783 | — | — | 235,398 | |||||||||||||||||||||||
| Interest and other expense, net |
(6,409 | ) | 6,048 | (361 | ) | |||||||||||||||||||||||||||
| Income taxes |
40,573 | 5,587 | 46,160 | |||||||||||||||||||||||||||||
|
|
|
|
|
|
|
|
|
|
|
|
|
|
|
|
|
|||||||||||||||||
| Net income |
151,852 | 15,759 | 26,520 | (12,498 | ) | 6,783 | 6,048 | (5,587 | ) | 188,877 | ||||||||||||||||||||||
|
|
|
|
|
|
|
|
|
|
|
|
|
|
|
|
|
|||||||||||||||||
| Net income attributable to noncontrolling interests |
719 | 719 | ||||||||||||||||||||||||||||||
|
|
|
|
|
|
|
|
|
|
|
|
|
|
|
|
|
|||||||||||||||||
| Net income attributable to Amdocs Limited |
$ | 151,133 | $ | 15,759 | $ | 26,520 | $ | (12,498 | ) | $ | 6,783 | $ | 6,048 | $ | (5,587 | ) | $ | 188,158 | ||||||||||||||
|
|
|
|
|
|
|
|
|
|
|
|
|
|
|
|
|
|||||||||||||||||
AMDOCS LIMITED
Condensed Consolidated Balance Sheets
(In thousands)
| As of | ||||||||
| December 31, 2025 |
September 30, 2025 |
|||||||
| ASSETS |
||||||||
| Current assets: |
||||||||
| Cash and cash equivalents |
$ | 247,875 | $ | 324,999 | ||||
| Accounts receivable, net, including unbilled |
962,780 | 935,751 | ||||||
| Prepaid expenses and other current assets |
333,224 | 331,387 | ||||||
|
|
|
|
|
|||||
| Total current assets |
1,543,879 | 1,592,137 | ||||||
| Property and equipment, net |
744,706 | 768,557 | ||||||
| Lease assets |
179,081 | 182,088 | ||||||
| Goodwill and other intangible assets, net |
3,247,622 | 3,046,962 | ||||||
| Other noncurrent assets |
628,794 | 660,086 | ||||||
|
|
|
|
|
|||||
| Total assets |
$ | 6,344,082 | $ | 6,249,830 | ||||
|
|
|
|
|
|||||
| LIABILITIES AND SHAREHOLDERS’ EQUITY |
||||||||
| Current liabilities |
||||||||
| Accounts payable, accruals and other |
$ | 1,167,772 | $ | 1,201,206 | ||||
| Short-term financing arrangements |
130,000 | — | ||||||
| Lease liabilities |
37,808 | 38,725 | ||||||
| Deferred revenue |
125,209 | 118,861 | ||||||
|
|
|
|
|
|||||
| Total current liabilities |
1,460,789 | 1,358,792 | ||||||
| Lease liabilities |
137,495 | 140,776 | ||||||
| Long-term debt, net of unamortized debt issuance costs |
647,058 | 646,901 | ||||||
| Other noncurrent liabilities |
633,620 | 632.681 | ||||||
| Total Amdocs Limited Shareholders’ equity |
3,423,005 | 3,429,453 | ||||||
| Noncontrolling interests |
42,115 | 41,227 | ||||||
|
|
|
|
|
|||||
| Total equity |
3,465,120 | 3,470,680 | ||||||
|
|
|
|
|
|||||
| Total liabilities and equity |
$ | 6,344,082 | $ | 6,249,830 | ||||
|
|
|
|
|
|||||
AMDOCS LIMITED
Consolidated Statements of Cash Flows
(In thousands)
| Three months ended December 31, |
||||||||
| 2025 | 2024 | |||||||
| Cash Flow from Operating Activities: |
||||||||
| Net income |
$ | 158,454 | $ | 151,852 | ||||
| Reconciliation of net income to net cash provided by operating activities: |
||||||||
| Depreciation, amortization and impairment |
50,736 | 46,968 | ||||||
| Amortization of debt issuance cost |
157 | 151 | ||||||
| Equity-based compensation expense |
24,090 | 26,520 | ||||||
| Deferred income taxes |
15,152 | 1,651 | ||||||
| Loss from short-term interest-bearing investments |
— | 662 | ||||||
| Net changes in operating assets and liabilities, net of amounts acquired: |
||||||||
| Accounts receivable, net |
(14,547 | ) | 2,417 | |||||
| Prepaid expenses and other current assets |
18,816 | (14,787 | ) | |||||
| Other noncurrent assets |
17,597 | (7,925 | ) | |||||
| Lease assets and liabilities, net |
(1,190 | ) | (2,329 | ) | ||||
| Accounts payable, accrued expenses and accrued personnel |
(19,383 | ) | (50,837 | ) | ||||
| Deferred revenue |
6,516 | 867 | ||||||
| Income taxes payable, net |
(9,327 | ) | (5,129 | ) | ||||
| Other noncurrent liabilities |
(26,889 | ) | (44,526 | ) | ||||
|
|
|
|
|
|||||
| Net cash provided by operating activities |
$ | 220,182 | $ | 105,555 | ||||
|
|
|
|
|
|||||
| Cash Flow from Investing Activities: |
||||||||
| Purchase of property and equipment, net (a) |
(32,239 | ) | (27,355 | ) | ||||
| Proceeds from sale of short-term interest-bearing investments |
— | 33,362 | ||||||
| Net cash paid for business acquisitions |
(194,489 | ) | (57,083 | ) | ||||
| Net Cash from equity investments and other |
1,846 | 16,347 | ||||||
|
|
|
|
|
|||||
| Net cash used in investing activities |
$ | (224,882 | ) | $ | (34,729 | ) | ||
|
|
|
|
|
|||||
| Cash Flow from Financing Activities: |
||||||||
| Repurchase of shares |
(146,168 | ) | (144,483 | ) | ||||
| Proceeds from employee stock option exercises |
1,700 | 4,408 | ||||||
| Payments of dividends |
(57,156 | ) | (54,081 | ) | ||||
| Distribution to noncontrolling interests |
— | (1,323 | ) | |||||
| Borrowings under financing arrangements |
130,000 | — | ||||||
| Payment of contingent consideration and deferred payment of business acquisitions |
(800 | ) | (7,599 | ) | ||||
|
|
|
|
|
|||||
| Net cash used in financing activities |
$ | (72,424 | ) | $ | (203,078 | ) | ||
|
|
|
|
|
|||||
| Net decrease in cash and cash equivalents |
(77,124 | ) | (132,252 | ) | ||||
| Cash and cash equivalents at beginning of period |
324,999 | 346,085 | ||||||
|
|
|
|
|
|||||
| Cash and cash equivalents at end of period |
$ | 247,875 | $ | 213,833 | ||||
|
|
|
|
|
|||||
AMDOCS LIMITED
Supplementary Information
(In millions)
| Three months ended | ||||||||||||||||||||
| December 31, 2025 |
September 30, 2025 |
June 30, 2025 |
March 31, 2025 |
December 31, 2024 |
||||||||||||||||
| North America |
$ | 764.7 | $ | 762.4 | $ | 745.4 | $ | 738.3 | $ | 737.4 | ||||||||||
| Europe |
181.7 | 179.8 | 189.4 | 180.7 | 155.2 | |||||||||||||||
| Rest of the World |
209.5 | 208.0 | 209.6 | 209.2 | 217.4 | |||||||||||||||
|
|
|
|
|
|
|
|
|
|
|
|||||||||||
| Total Revenue |
$ | 1,155.9 | $ | 1,150.2 | $ | 1,144.4 | $ | 1,128.2 | $ | 1,110.1 | ||||||||||
|
|
|
|
|
|
|
|
|
|
|
|||||||||||
| Three months ended | ||||||||||||||||||||
| December 31, 2025 |
September 30, 2025 |
June 30, 2025 |
March 31, 2025 |
December 31, 2024 |
||||||||||||||||
| Managed Services Revenue |
$ | 745.9 | $ | 748.3 | $ | 771.5 | $ | 747.1 | $ | 728.9 | ||||||||||
|
|
|
|
|
|
|
|
|
|
|
|||||||||||
| as of | ||||||||||||||||||||
| December 31, 2025 |
September 30, 2025 |
June 30, 2025 |
March 31, 2025 |
December 31, 2024 |
||||||||||||||||
| 12-Month Backlog |
$ | 4,250 | $ | 4,190 | $ | 4,150 | $ | 4,170 | $ | 4,140 | ||||||||||
|
|
|
|
|
|
|
|
|
|
|
|||||||||||
# # #

Exhibit 99.2 Amdocs Limited NASDAQ: DOX Fiscal Q1 2026 Earnings Presentation February 3, 2026 Shuky Sheffer President & CEO Tamar Rapaport-Dagim CFO & COO
Disclaimer The information contained herein in this presentation or delivered or to be delivered to you during this presentation does not constitute an offer, expressed or implied, or a recommendation to do any transaction in Amdocs Limited securities or in any securities of its affiliates or subsidiaries. This presentation and the comments made by members of Amdocs management in conjunction with it can be found on the Investor Relations section of our website, and, as always, a copy of today’s prepared remarks will also be posted immediately following the conclusion of this call. This presentation includes information that constitutes forward- looking statements made pursuant to the safe harbor provision of the Private Securities Litigation Reform Act of 1995, including statements about Amdocs’ growth and business results in future quarters and years. Although we believe the expectations reflected in such forward-looking statements are based upon reasonable assumptions, we can give no assurance that our expectations will be obtained or that any deviations will not be material. Such statements involve risks and uncertainties that may cause future results to differ from those anticipated. These risks include, but are not limited to, the effects of general macroeconomic conditions, prevailing level of macroeconomic, business and operational uncertainty, including as a result of geopolitical events or other regional events or pandemics, changes to trade policies including tariffs and trade restrictions, as well as the current inflationary environment, and the effects of these conditions on the Company’s customers’ businesses and levels of business activity, including the effect of the current economic uncertainty and industry pressure on the spending decisions of the Company’s customers. Amdocs’ ability to grow in the business markets that it serves, Amdocs’ ability to successfully integrate acquired businesses, adverse effects of market competition, rapid technological shifts that may render the Company’s products and services obsolete, security incidents, including breaches and cyberattacks to our systems and networks and those of our partners or customers, potential loss of a major customer, our ability to develop long-term relationships with our customers, our ability to successfully and effectively implement artificial intelligence and Generative AI in the Company’s offerings and operations, and risks associated with operating businesses in the international market. Amdocs may elect to update these forward-looking statements at some point in the future; however, Amdocs specifically disclaims any obligation to do so. These and other risks are discussed at greater length in Amdocs’ filings with the Securities and Exchange Commission, including in our Annual Report on Form 20-F for the fiscal year ended September 30, 2025 filed on December 15, 2025. This presentation includes non-GAAP financial measures, including non-GAAP operating margin, free cash flow, revenue on a constant currency basis, non-GAAP net income, non-GAAP net income attributable to Amdocs Limited, and non-GAAP earnings per share. Free cash flow equals cash generated by operating activities less net capital expenditures. While in prior years Amdocs used normalized free cash flow, a measure of our operating performance, is further adjusted to exclude net capital expenditures related to the new campus development, payments for non-recurring and unusual charges (such as capital gains tax to be paid in relation to the divestiture of OpenMarket), and payments of acquisition related liabilities, Amdocs is no longer reporting normalized free cash flow. Normalized free cash flow is not comparable to free cash flow. These non-GAAP financial measures are not in accordance with, or an alternative for, generally accepted accounting principles and may be different from non-GAAP financial measures used by other companies. In addition, these non-GAAP financial measures are not based on any comprehensive set of accounting rules or principles. Amdocs believes that non-GAAP financial measures have limitations in that they do not reflect all of the amounts associated with Amdocs’ results of operations as determined in accordance with GAAP and that these measures should only be used to evaluate Amdocs’ results of operations in conjunction with the corresponding GAAP measures. Please refer to the appendix for a reconciliation of these metrics to the most comparable GAAP provision. This presentation also includes pro forma metrics which exclude the financial impact of OpenMarket (divested on December 31, 2020) from fiscal year 2021. Please also review the information contained in Amdocs’ press release dated February 3, 2026, with respect to earnings for fiscal Q1 2026. The press release contains additional information regarding Amdocs’ outlook for fiscal year 2026 and certain non-GAAP metrics and their reconciliations. Information Security Level 0 – Public. © 2026 – Proprietary & Confidential Information of Amdocs Information Security Level 0 – Public. © 2025 Public. © 2026 – Proprietary & Confidential Information of Amdocs 2 2

Today’s Speakers Shuky Sheffer President & Chief Executive Officer Tamar Rapaport-Dagim Chief Financial Officer & Chief Operating Officer Information Security Level 0 – Public. © 2026 – Proprietary & Confidential Information of Amdocs 3 3 3

Earnings Call Agenda 1 Strategy & business performance update Shuky Sheffer, President & Chief Executive Officer 2 Financial review & outlook Tamar Rapaport-Dagim, Chief Financial Officer & Chief Operating Officer 3 Q&A Information Security Level 0 – Public. © 2026 – Proprietary & Confidential Information of Amdocs 4 4 4

Shuky Sheffer President & Chief Executive Officer Strategy and business performance update Information Security Level 0 – Public. © 2026 – Proprietary & Confidential Information of Amdocs 5 5
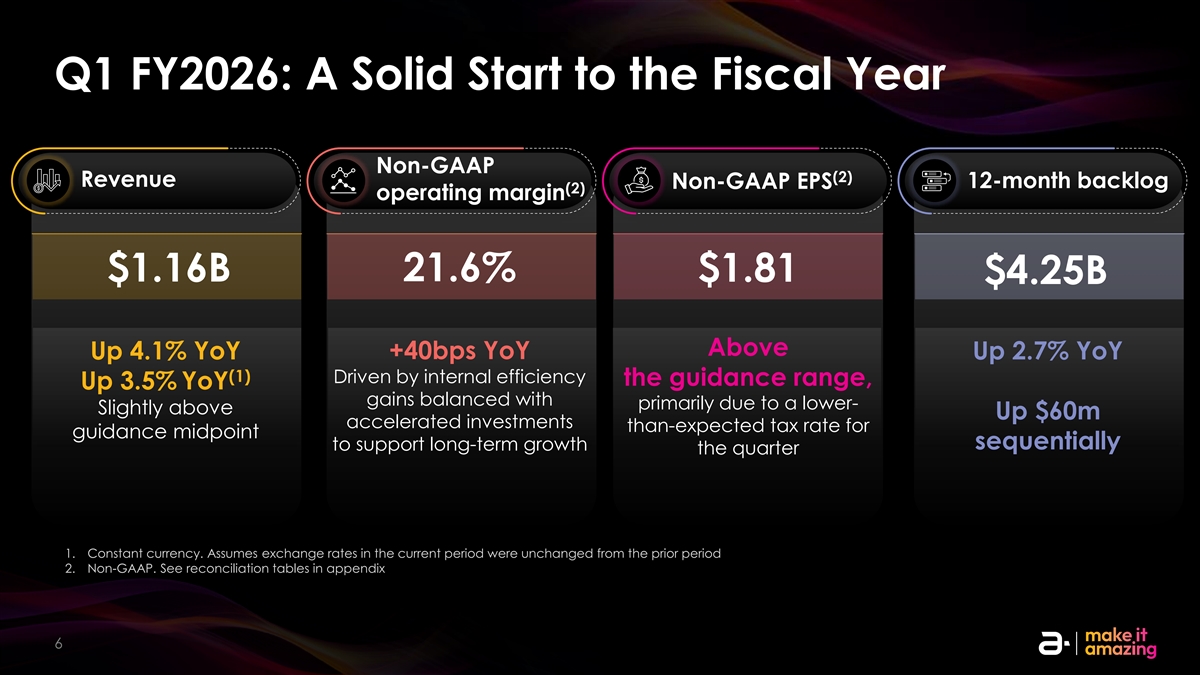
Q1 FY2026: A Solid Start to the Fiscal Year Non-GAAP (2) Revenue Non-GAAP EPS 12-month backlog (2) operating margin $1.16B 21.6% $1.81 $4.25B Above +40bps YoY Up 4.1% YoY Up 2.7% YoY (1) Driven by internal efficiency the guidance range, Up 3.5% YoY gains balanced with primarily due to a lower- Slightly above Up $60m accelerated investments than-expected tax rate for guidance midpoint sequentially to support long-term growth the quarter 1. Constant currency. Assumes exchange rates in the current period were unchanged from the prior period 2. Non-GAAP. See reconciliation tables in appendix Information Security Level 0 – Public. © 2026 – Proprietary & Confidential Information of Amdocs 6 6
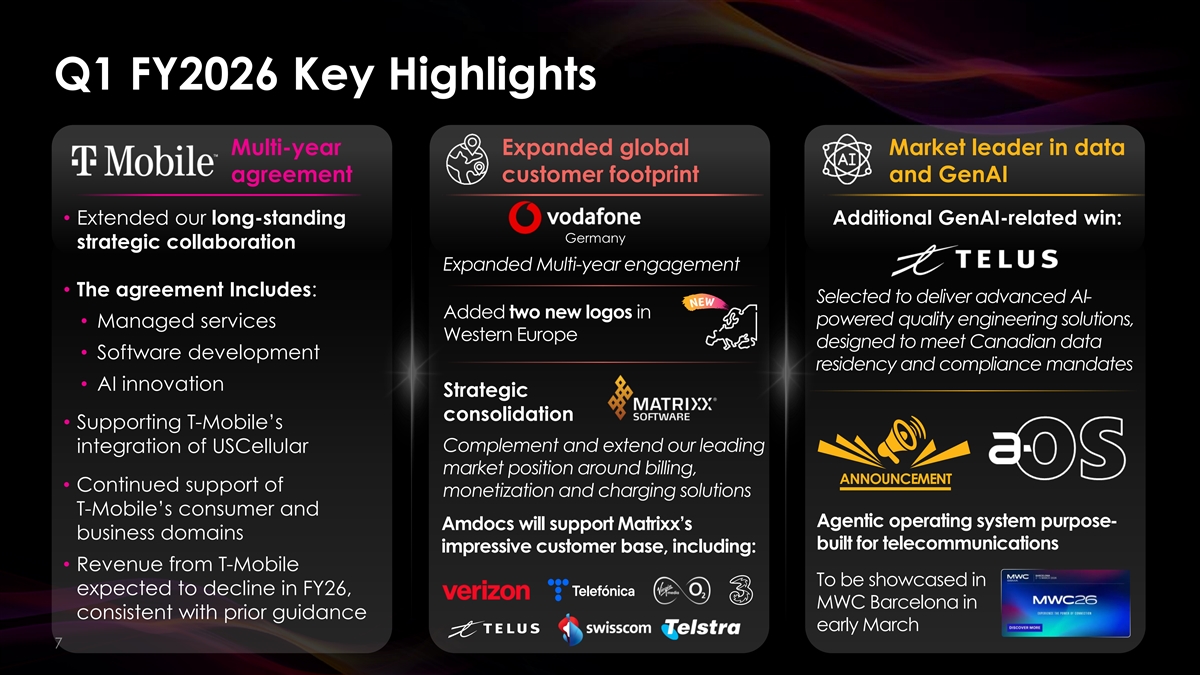
Q1 FY2026 Key Highlights Multi-year Expanded global Market leader in data agreement customer footprint and GenAI • Extended our long-standing Additional GenAI-related win: Germany strategic collaboration Expanded Multi-year engagement • The agreement Includes: Selected to deliver advanced AI- Added two new logos in powered quality engineering solutions, • Managed services Western Europe designed to meet Canadian data • Software development residency and compliance mandates • AI innovation Strategic consolidation • Supporting T-Mobile’s Complement and extend our leading integration of USCellular market position around billing, • Continued support of monetization and charging solutions T-Mobile’s consumer and Agentic operating system purpose- Amdocs will support Matrixx’s business domains built for telecommunications impressive customer base, including: • Revenue from T-Mobile To be showcased in expected to decline in FY26, MWC Barcelona in consistent with prior guidance early March Information Security Level 0 – Public. © 2026 – Proprietary & Confidential Information of Amdocs 7 7
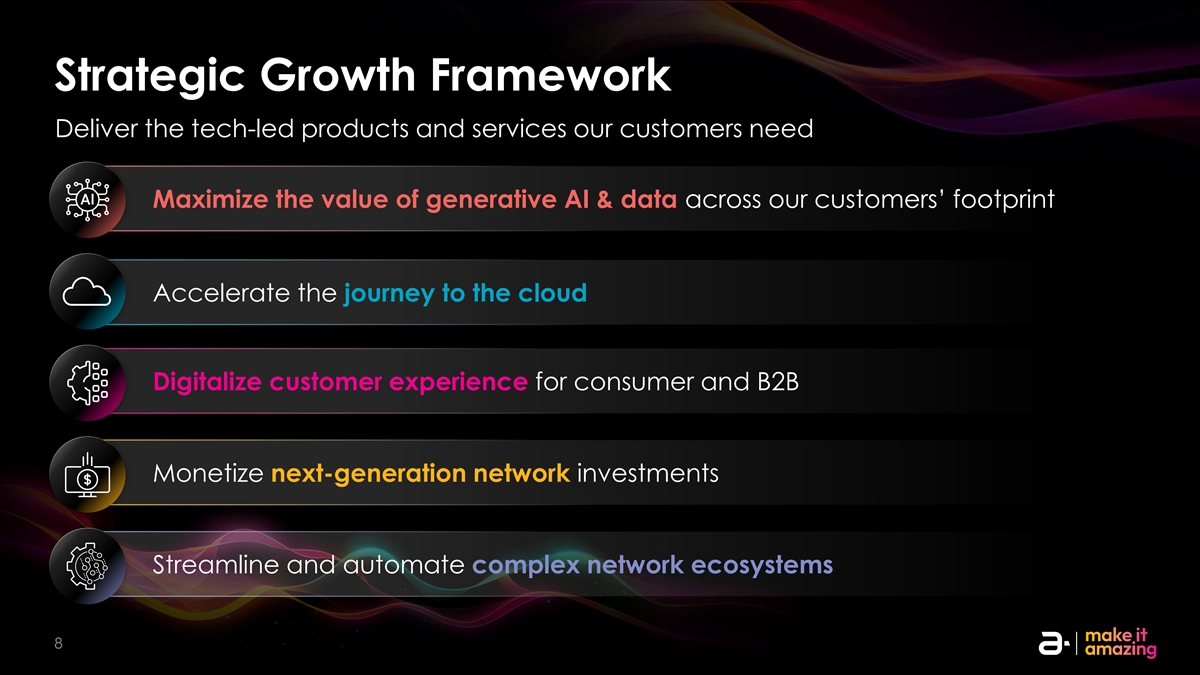
Strategic Growth Framework Deliver the tech-led products and services our customers need Maximize the value of generative AI & data across our customers’ footprint Accelerate the journey to the cloud Digitalize customer experience for consumer and B2B Monetize next-generation network investments Streamline and automate complex network ecosystems Information Security Level 0 – Public. © 2026 – Proprietary & Confidential Information of Amdocs 8 8 8 8

Progress in Strategic Domains – Generative AI (1/2) Simplify and accelerate the adoption of Generative AI Generative AI and data Selected projects Business value Recently teamed up with NVIDIA and Designed to meet Canadian data residency and Telus to deliver advanced AI-powered compliance mandates to enable secure, quality engineering solutions on the TELUS autonomous testing automation and validation for Sovereign Cloud Canadian enterprises and government agencies Our generative Leveraging NVIDIA AI capabilities AI platform Busy executing on the recent GenAI-related commercial awards we have won And more.. Germany Information Security Level 0 – Public. © 2026 – Proprietary & Confidential Information of Amdocs 9 9
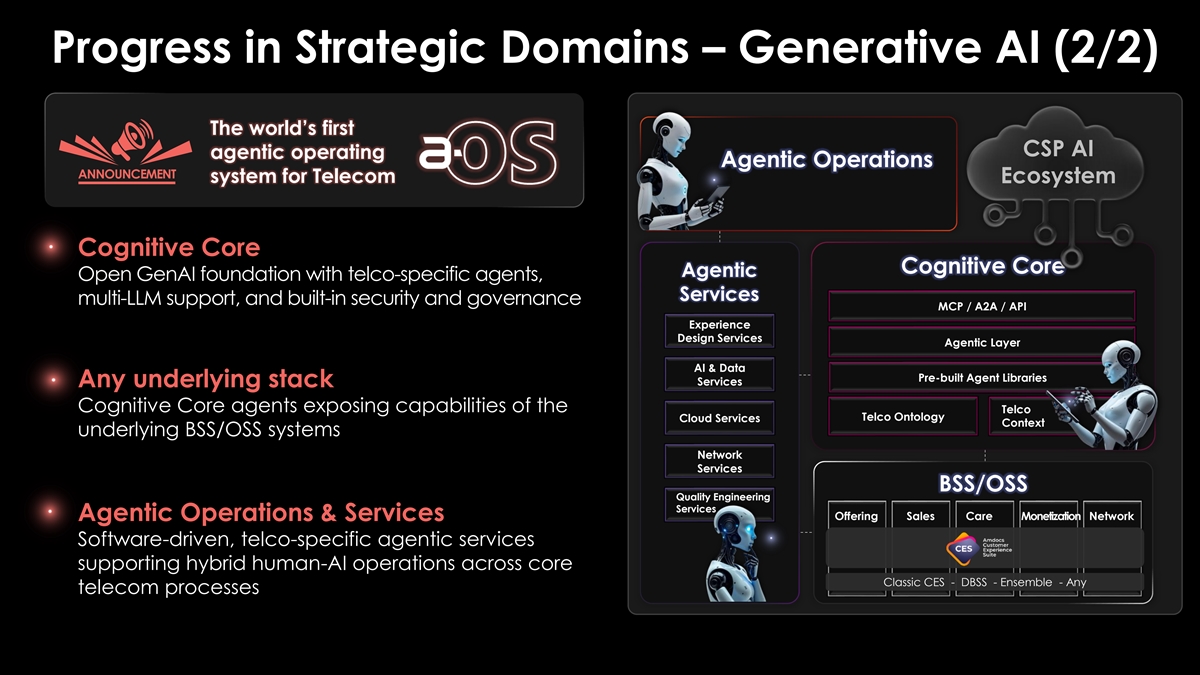
Progress in Strategic Domains – Generative AI (2/2) The world’s first CSP AI agentic operating Agentic Operations system for Telecom Ecosystem Cognitive Core Cognitive Core Agentic Open GenAI foundation with telco-specific agents, Services multi-LLM support, and built-in security and governance MCP / A2A / API Experience Design Services Agentic Layer AI & Data Pre-built Agent Libraries Services Any underlying stack Cognitive Core agents exposing capabilities of the Telco Telco Ontology Cloud Services Context underlying BSS/OSS systems Network Services BSS/OSS Quality Engineering Services Offering Sales Care Monetization Network Agentic Operations & Services Software-driven, telco-specific agentic services supporting hybrid human-AI operations across core Classic CES - DBSS - Ensemble - Any telecom processes Information Security Level 0 – Public. © 2026 – Proprietary & Confidential Information of Amdocs 10 10
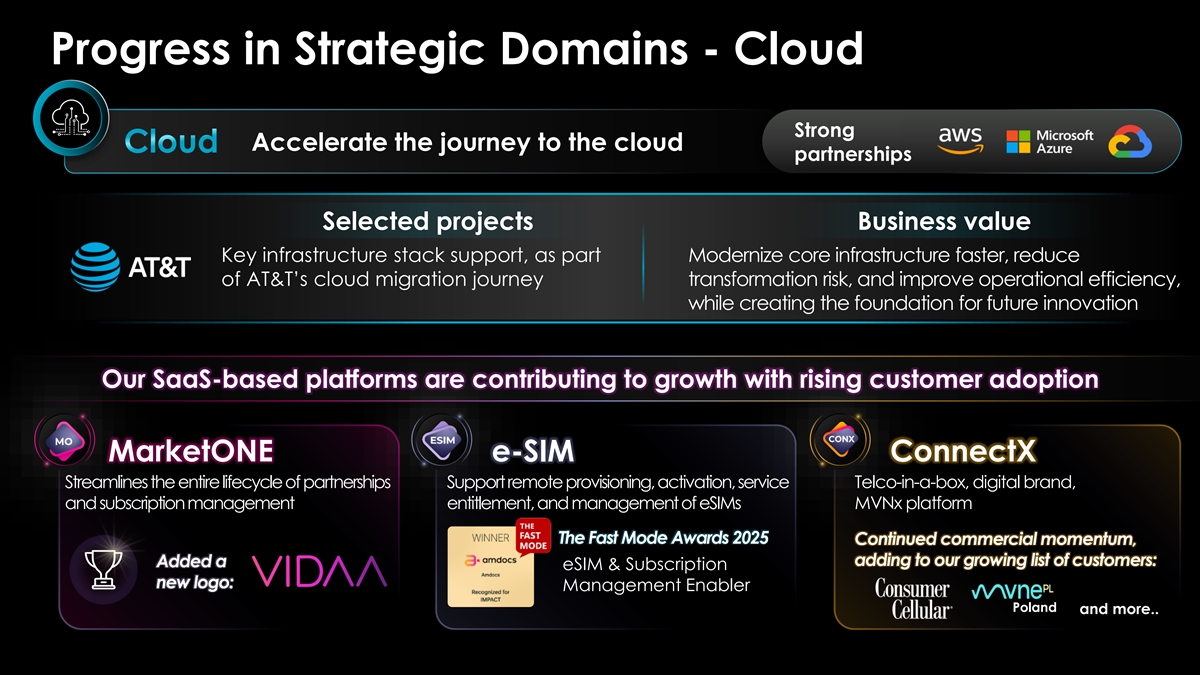
Progress in Strategic Domains - Cloud Strong Accelerate the journey to the cloud Cloud partnerships Selected projects Business value Key infrastructure stack support, as part Modernize core infrastructure faster, reduce of AT&T’s cloud migration journey transformation risk, and improve operational efficiency, while creating the foundation for future innovation Our SaaS-based platforms are contributing to growth with rising customer adoption MarketONE e-SIM ConnectX Streamlines the entire lifecycle of partnerships Support remote provisioning, activation, service Telco-in-a-box, digital brand, and subscription management entitlement, and management of eSIMs MVNx platform The Fast Mode Awards 2025 Continued commercial momentum, adding to our growing list of customers: Added a eSIM & Subscription new logo: Management Enabler Poland and more.. Information Security Level 0 – Public. © 2026 – Proprietary & Confidential Information of Amdocs 11 11
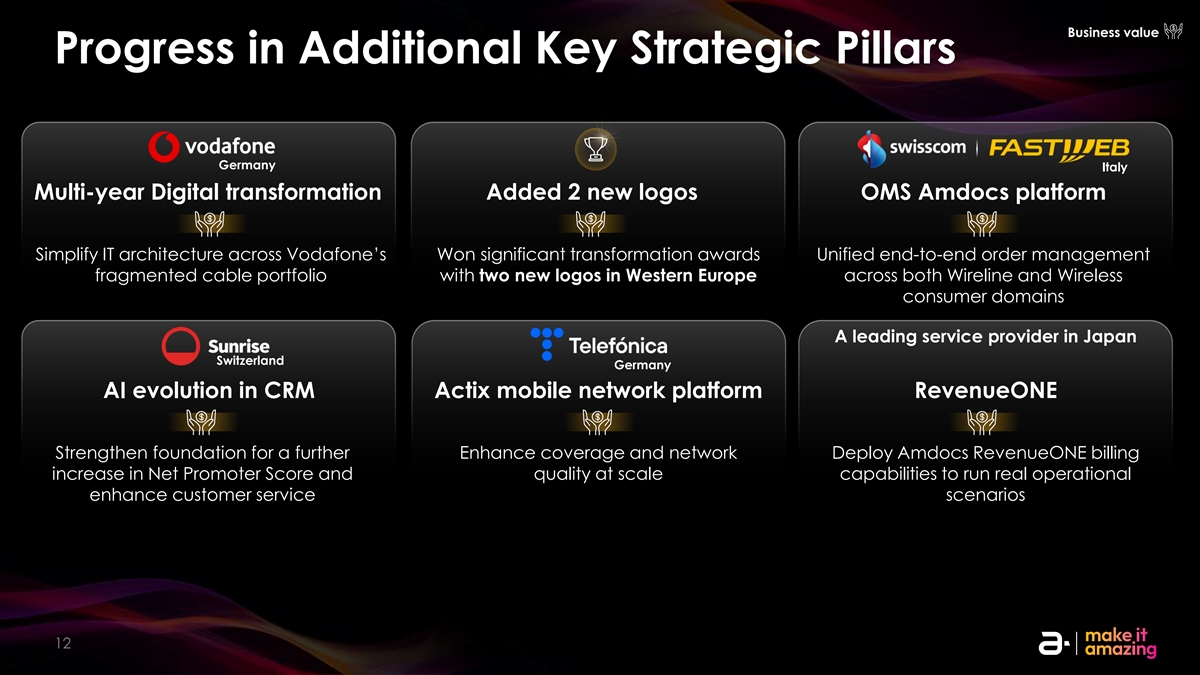
Business value Progress in Additional Key Strategic Pillars Germany Italy Multi-year Digital transformation Added 2 new logos OMS Amdocs platform Simplify IT architecture across Vodafone’s Won significant transformation awards Unified end-to-end order management fragmented cable portfolio with two new logos in Western Europe across both Wireline and Wireless consumer domains A leading service provider in Japan Switzerland Germany AI evolution in CRM Actix mobile network platform RevenueONE Strengthen foundation for a further Enhance coverage and network Deploy Amdocs RevenueONE billing increase in Net Promoter Score and quality at scale capabilities to run real operational enhance customer service scenarios Information Security Level 2 – Sensitive. © 2026 – Proprietary & Confidential Information of Amdocs 12 12
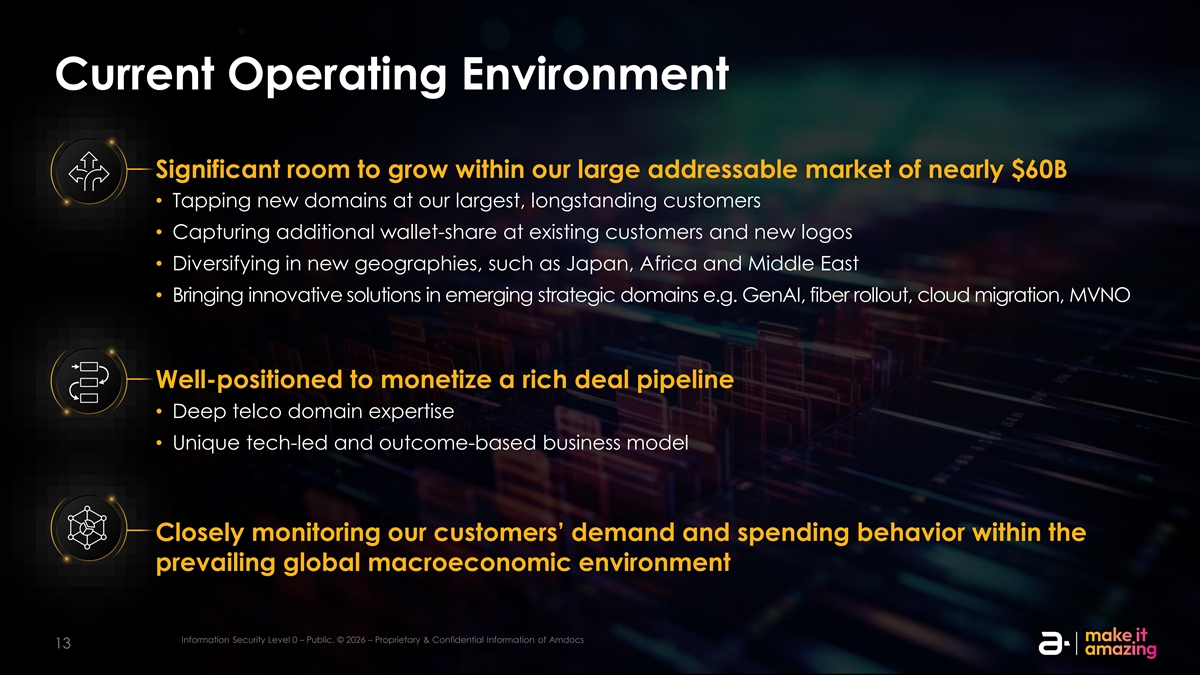
Current Operating Environment Significant room to grow within our large addressable market of nearly $60B • Tapping new domains at our largest, longstanding customers • Capturing additional wallet-share at existing customers and new logos • Diversifying in new geographies, such as Japan, Africa and Middle East • Bringing innovative solutions in emerging strategic domains e.g. GenAI, fiber rollout, cloud migration, MVNO Well-positioned to monetize a rich deal pipeline • Deep telco domain expertise • Unique tech-led and outcome-based business model Closely monitoring our customers’ demand and spending behavior within the prevailing global macroeconomic environment Information Security Level 0 – Public. © 2026 – Proprietary & Confidential Information of Amdocs Information Security Level 0 – Public. © 2026 – Proprietary & Confidential Information of Amdocs 13 13
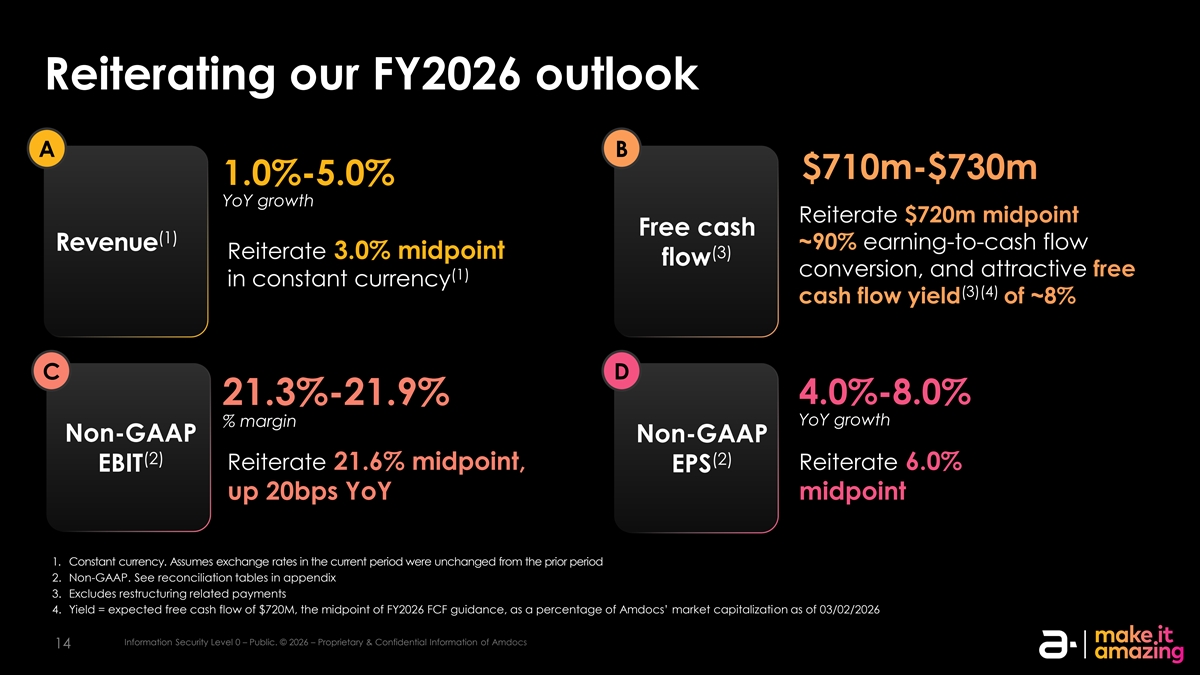
Reiterating our FY2026 outlook A B $710m-$730m 1.0%-5.0% YoY growth Reiterate $720m midpoint Free cash (1) ~90% earning-to-cash flow Revenue Reiterate 3.0% midpoint (3) flow conversion, and attractive free (1) in constant currency (3)(4) cash flow yield of ~8% C D 4.0%-8.0% 21.3%-21.9% YoY growth % margin Non-GAAP Non-GAAP (2) (2) Reiterate 21.6% midpoint, Reiterate 6.0% EBIT EPS up 20bps YoY midpoint 1. Constant currency. Assumes exchange rates in the current period were unchanged from the prior period 2. Non-GAAP. See reconciliation tables in appendix 3. Excludes restructuring related payments 4. Yield = expected free cash flow of $720M, the midpoint of FY2026 FCF guidance, as a percentage of Amdocs’ market capitalization as of 03/02/2026 Information Security Level 0 – Public. © 2026 – Proprietary & Confidential Information of Amdocs 14

Shimie Hortig to Succeed Shuky Sheffer as President and CEO, Effective March 31, 2026 Shimie Hortig • President of the Americas Group, Amdocs’ largest region • Led company-wide strategic growth initiatives and built strong partnerships • A versatile and long-tenured Amdocs leader with senior roles across business, services, and corporate functions • 20 years of experience in technology and telecommunications Information Security Level 0 – Public. © 2026 – Proprietary & Confidential Information of Amdocs 15 15

Tamar Rapaport-Dagim Chief Financial Officer & Chief Operating Officer Financial review & outlook Information Security Level 0 – Public. © 2026 – Proprietary & Confidential Information of Amdocs 16 16
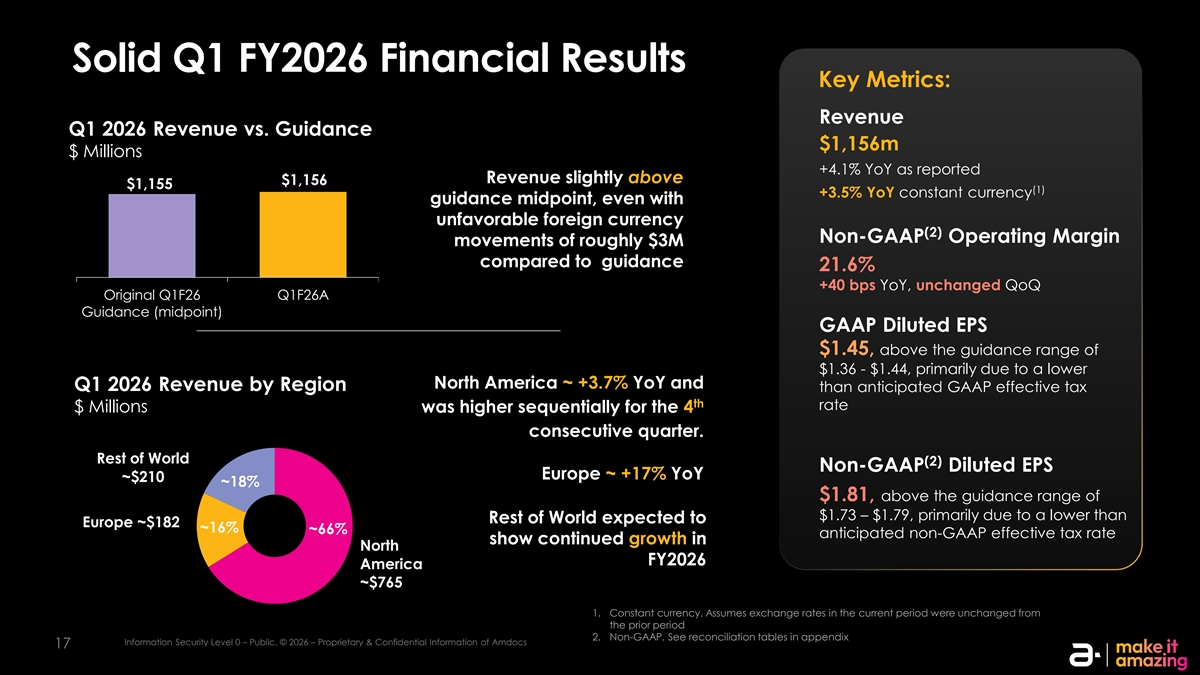
Solid Q1 FY2026 Financial Results Key Metrics: Revenue Q1 2026 Revenue vs. Guidance $1,156m $ Millions +4.1% YoY as reported Revenue slightly above $1,156 $1,155 (1) +3.5% YoY constant currency guidance midpoint, even with unfavorable foreign currency (2) Non-GAAP Operating Margin movements of roughly $3M compared to guidance 21.6% +40 bps YoY, unchanged QoQ Original Q1F26 Q1F26A Guidance (midpoint) GAAP Diluted EPS $1.45, above the guidance range of $1.36 - $1.44, primarily due to a lower North America ~ +3.7% YoY and Q1 2026 Revenue by Region than anticipated GAAP effective tax th rate $ Millions was higher sequentially for the 4 consecutive quarter. Rest of World (2) Non-GAAP Diluted EPS Europe ~ +17% YoY ~$210 ~18% $1.81, above the guidance range of $1.73 – $1.79, primarily due to a lower than Rest of World expected to Europe ~$182 ~16% ~66% anticipated non-GAAP effective tax rate show continued growth in North FY2026 America ~$765 1. Constant currency. Assumes exchange rates in the current period were unchanged from the prior period 2. Non-GAAP. See reconciliation tables in appendix Information Security Level 0 – Public. © 2026 – Proprietary & Confidential Information of Amdocs 17
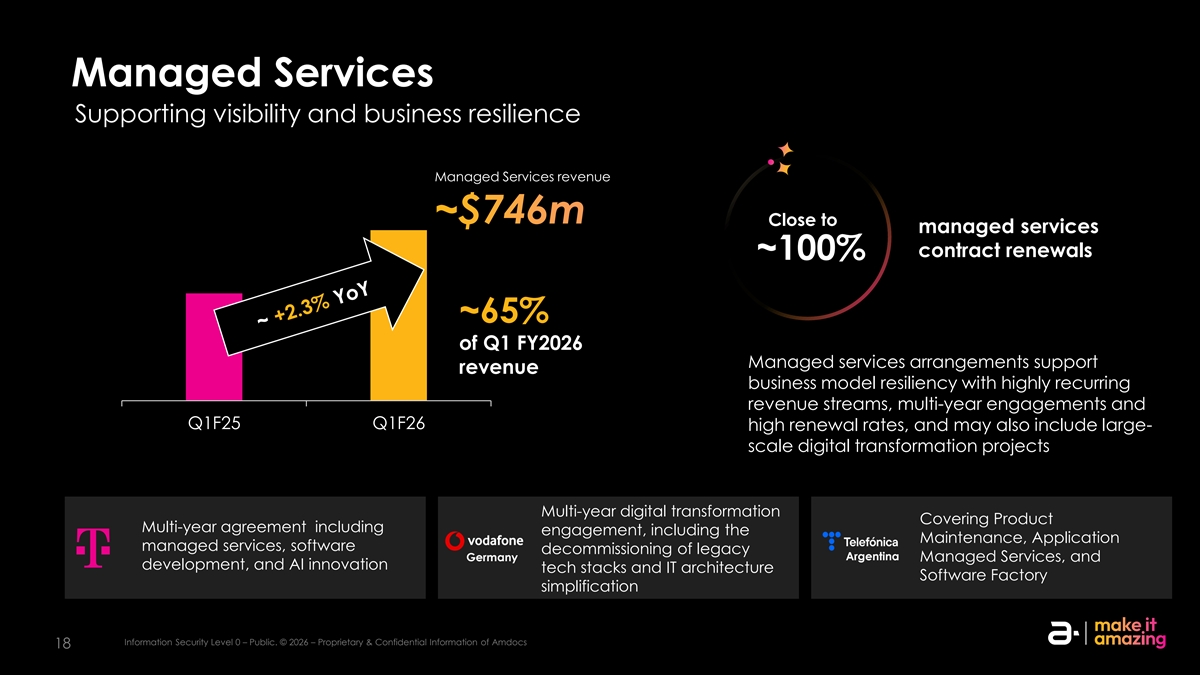
Managed Services Supporting visibility and business resilience Managed Services revenue 760.0 750.0 ~$746m Close to managed services 740.0 contract renewals ~100% 730.0 ~65% 720.0 of Q1 FY2026 Managed services arrangements support 710.0 revenue business model resiliency with highly recurring 700.0 revenue streams, multi-year engagements and Q1F25 Q1F26 high renewal rates, and may also include large- scale digital transformation projects Multi-year digital transformation Covering Product Multi-year agreement including engagement, including the Maintenance, Application managed services, software decommissioning of legacy Argentina Germany Managed Services, and development, and AI innovation tech stacks and IT architecture Software Factory simplification Information Security Level 0 – Public. © 2026 – Proprietary & Confidential Information of Amdocs 18
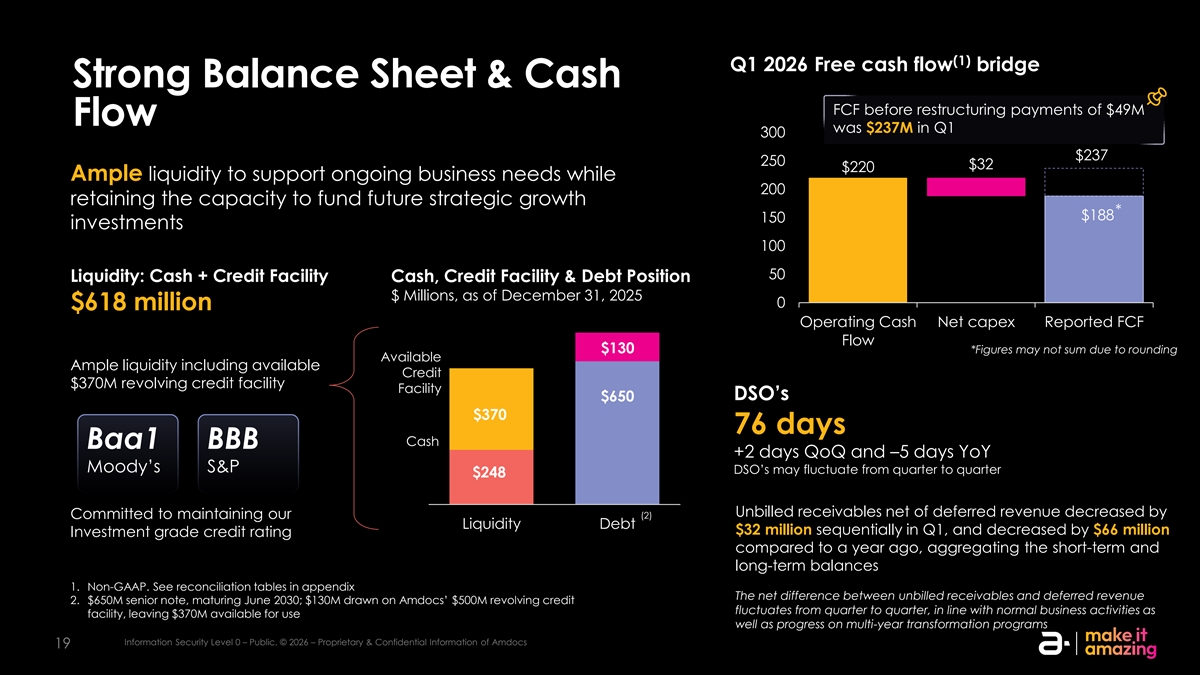
(1) Q1 2026 Free cash flow bridge Strong Balance Sheet & Cash FCF before restructuring payments of $49M Flow was $237M in Q1 300 $237 250 $32 $220 Ample liquidity to support ongoing business needs while 200 retaining the capacity to fund future strategic growth * $188 150 investments 100 50 Liquidity: Cash + Credit Facility Cash, Credit Facility & Debt Position $ Millions, as of December 31, 2025 0 $618 million Operating Cash Net capex Reported FCF Flow $130 *Figures may not sum due to rounding Available Ample liquidity including available Credit $370M revolving credit facility Facility DSO’s $650 $370 76 days Cash Baa1 BBB +2 days QoQ and –5 days YoY Moody’s S&P DSO’s may fluctuate from quarter to quarter $248 Unbilled receivables net of deferred revenue decreased by Committed to maintaining our (2) Liquidity Debt $32 million sequentially in Q1, and decreased by $66 million Investment grade credit rating compared to a year ago, aggregating the short-term and long-term balances 1. Non-GAAP. See reconciliation tables in appendix The net difference between unbilled receivables and deferred revenue 2. $650M senior note, maturing June 2030; $130M drawn on Amdocs’ $500M revolving credit fluctuates from quarter to quarter, in line with normal business activities as facility, leaving $370M available for use well as progress on multi-year transformation programs Information Security Level 0 – Public. © 2026 – Proprietary & Confidential Information of Amdocs 19
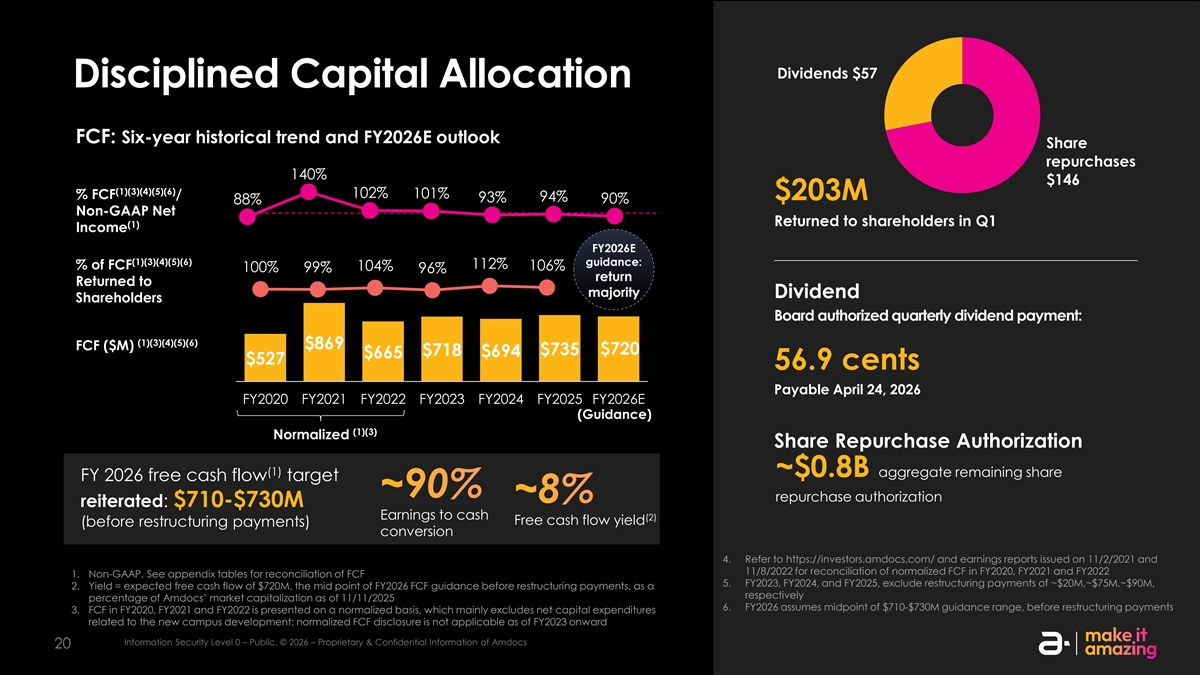
Dividends $57 Disciplined Capital Allocation FCF: Six-year historical trend and FY2026E outlook Share repurchases 140% $146 (1)(3)(4)(5)(6) 102% % FCF / 101% $203M 94% 93% 90% 88% Non-GAAP Net Returned to shareholders in Q1 (1) Income FY2026E (1)(3)(4)(5)(6) guidance: 112% % of FCF 104% 106% 100% 99% 96% return Returned to majority Dividend Shareholders Board authorized quarterly dividend payment: (1)(3)(4)(5)(6) $869 FCF ($M) $735 $720 $718 $694 $665 $527 56.9 cents Payable April 24, 2026 FY2020 FY2021 FY2022 FY2023 FY2024 FY2025 FY2026E (Guidance) (1)(3) Normalized Share Repurchase Authorization (1) ~$0.8B aggregate remaining share FY 2026 free cash flow target ~90% repurchase authorization ~8% reiterated: $710-$730M Earnings to cash (2) Free cash flow yield (before restructuring payments) conversion 4. Refer to https://investors.amdocs.com/ and earnings reports issued on 11/2/2021 and 11/8/2022 for reconciliation of normalized FCF in FY2020, FY2021 and FY2022 1. Non-GAAP. See appendix tables for reconciliation of FCF 5. FY2023, FY2024, and FY2025, exclude restructuring payments of ~$20M,~$75M.~$90M, 2. Yield = expected free cash flow of $720M, the mid point of FY2026 FCF guidance before restructuring payments, as a respectively percentage of Amdocs’ market capitalization as of 11/11/2025 6. FY2026 assumes midpoint of $710-$730M guidance range, before restructuring payments 3. FCF in FY2020, FY2021 and FY2022 is presented on a normalized basis, which mainly excludes net capital expenditures related to the new campus development; normalized FCF disclosure is not applicable as of FY2023 onward Information Security Level 0 – Public. © 2026 – Proprietary & Confidential Information of Amdocs 20
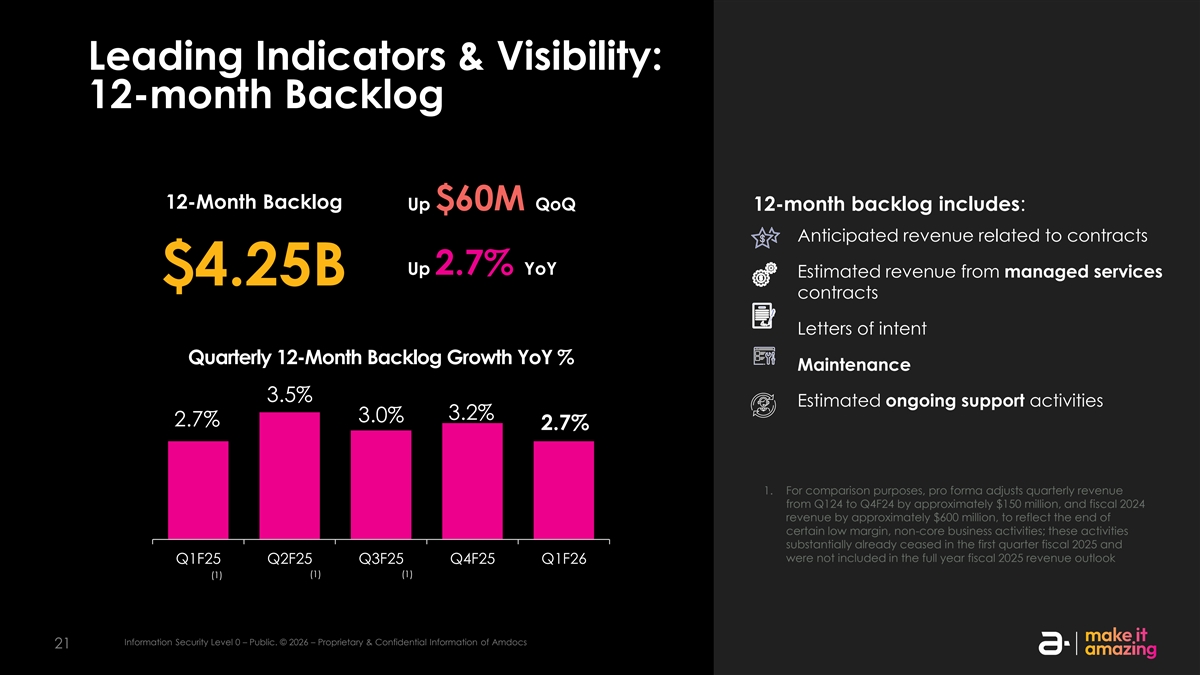
Leading Indicators & Visibility: 12-month Backlog 12-Month Backlog Up $60M QoQ 12-month backlog includes: Anticipated revenue related to contracts Up 2.7% YoY Estimated revenue from managed services $4.25B contracts Letters of intent Quarterly 12-Month Backlog Growth YoY % Maintenance 3.5% Estimated ongoing support activities 3.2% 3.0% 2.7% 2.7% 1. For comparison purposes, pro forma adjusts quarterly revenue from Q124 to Q4F24 by approximately $150 million, and fiscal 2024 revenue by approximately $600 million, to reflect the end of certain low margin, non-core business activities; these activities substantially already ceased in the first quarter fiscal 2025 and were not included in the full year fiscal 2025 revenue outlook Q1F25 Q2F25 Q3F25 Q4F25 Q1F26 (1) (1) (1) Information Security Level 0 – Public. © 2026 – Proprietary & Confidential Information of Amdocs 21
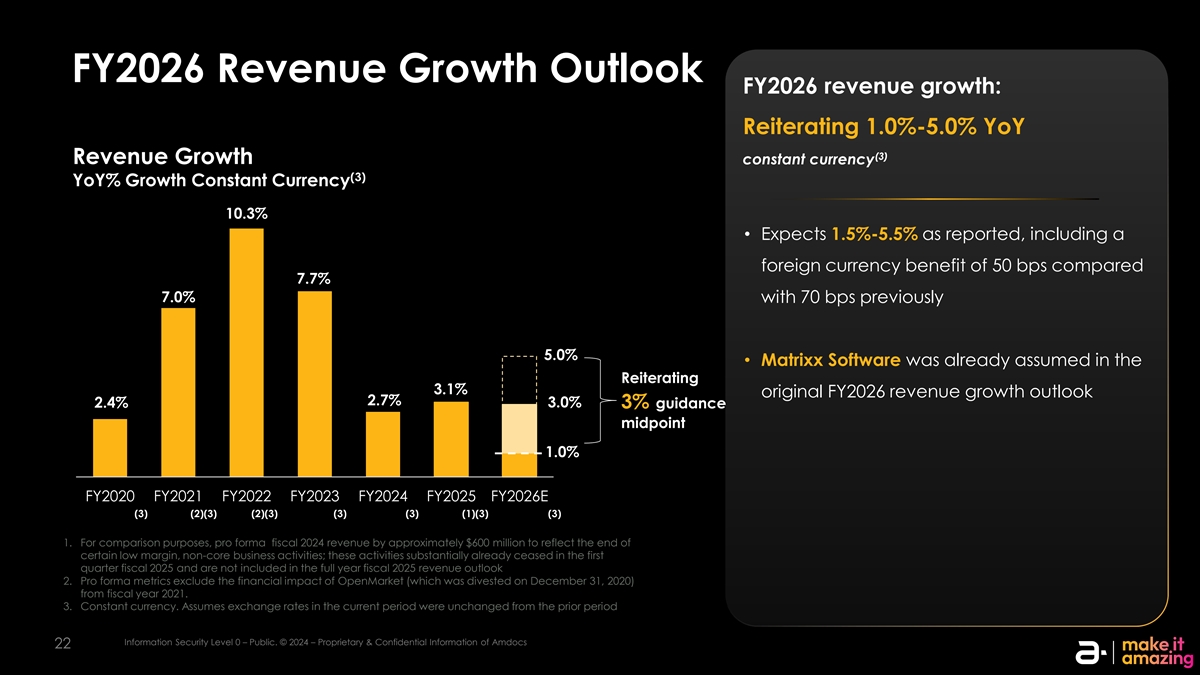
FY2026 Revenue Growth Outlook FY2026 revenue growth: Reiterating 1.0%-5.0% YoY (3) Revenue Growth constant currency (3) YoY% Growth Constant Currency 10.3% • Expects 1.5%-5.5% as reported, including a foreign currency benefit of 50 bps compared 7.7% 7.0% with 70 bps previously 5.0% • Matrixx Software was already assumed in the Reiterating 2% 3.1% original FY2026 revenue growth outlook 2.7% 2.4% 3.0% 3% guidance midpoint 1.0% FY2020 FY2021 FY2022 FY2023 FY2024 FY2025 FY2026E (3) (2)(3) (2)(3) (3) (3) (1)(3) (3) 1. For comparison purposes, pro forma fiscal 2024 revenue by approximately $600 million to reflect the end of certain low margin, non-core business activities; these activities substantially already ceased in the first quarter fiscal 2025 and are not included in the full year fiscal 2025 revenue outlook 2. Pro forma metrics exclude the financial impact of OpenMarket (which was divested on December 31, 2020) from fiscal year 2021. 3. Constant currency. Assumes exchange rates in the current period were unchanged from the prior period Information Security Level 0 – Public. © 2024 – Proprietary & Confidential Information of Amdocs 22
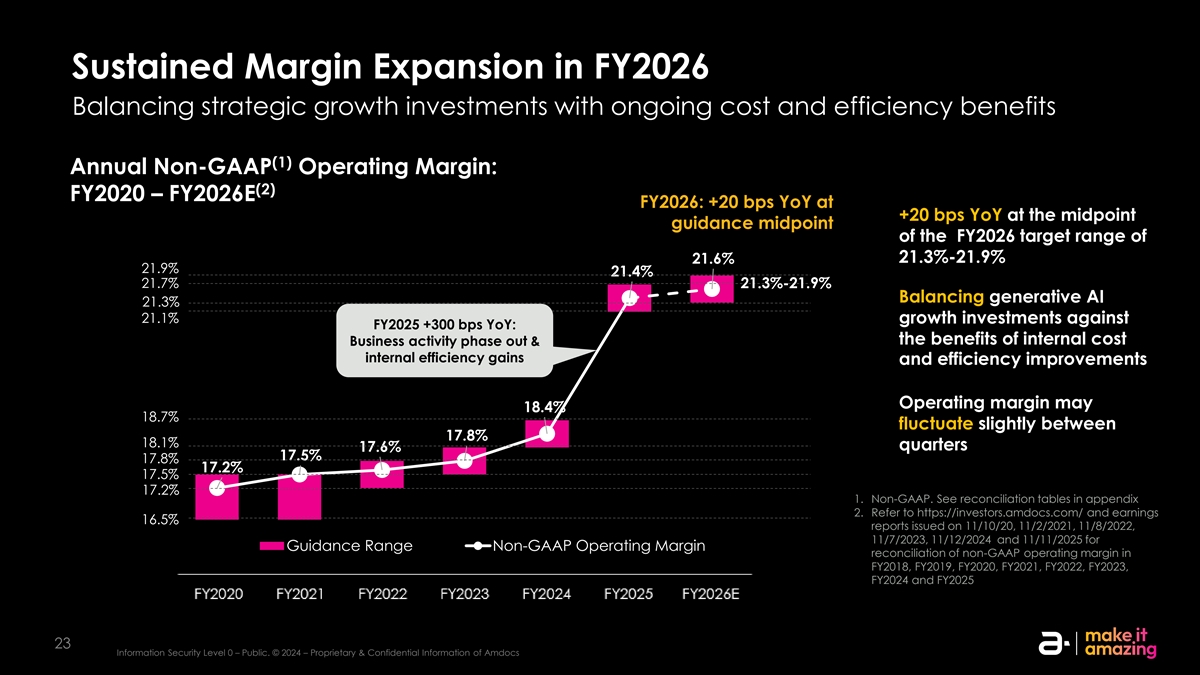
Sustained Margin Expansion in FY2026 Balancing strategic growth investments with ongoing cost and efficiency benefits (1) Annual Non-GAAP Operating Margin: (2) FY2020 – FY2026E FY2026: +20 bps YoY at +20 bps YoY at the midpoint guidance midpoint of the FY2026 target range of 21.3%-21.9% 21.6% 21.9% 21.4% 21.7% 21.3%-21.9% Balancing generative AI 21.3% 21.1% growth investments against FY2025 +300 bps YoY: the benefits of internal cost Business activity phase out & internal efficiency gains and efficiency improvements Operating margin may 18.4% 18.7% fluctuate slightly between 17.8% 18.1% quarters 17.6% 17.5% 17.8% 17.2% 17.5% 17.2% 1. Non-GAAP. See reconciliation tables in appendix 2. Refer to https://investors.amdocs.com/ and earnings 16.5% reports issued on 11/10/20, 11/2/2021, 11/8/2022, 11/7/2023, 11/12/2024 and 11/11/2025 for Guidance Range Non-GAAP Operating Margin reconciliation of non-GAAP operating margin in FY2018, FY2019, FY2020, FY2021, FY2022, FY2023, FY2024 and FY2025 23 Information Security Level 0 – Public. © 2024 – Proprietary & Confidential Information of Amdocs FY2020 FY2021 FY2022 FY2023 FY2024 FY2025 FY2026E
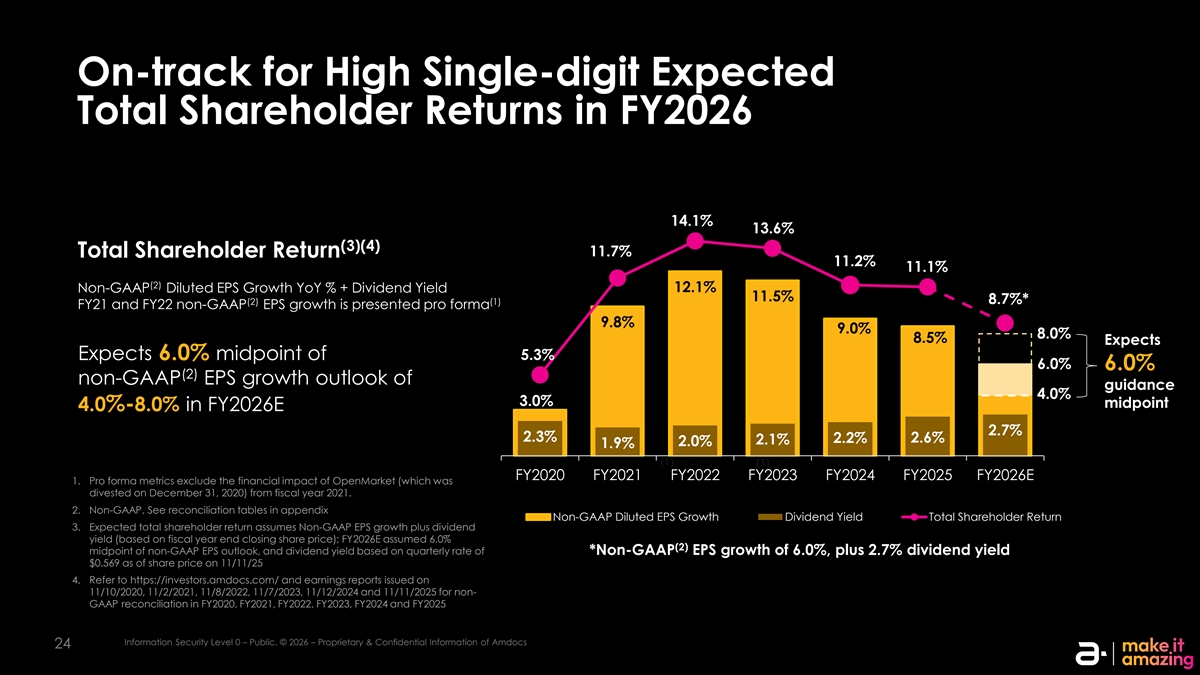
On-track for High Single-digit Expected Total Shareholder Returns in FY2026 14.1% 13.6% (3)(4) 11.7% Total Shareholder Return 11.2% 11.1% (2) Non-GAAP Diluted EPS Growth YoY % + Dividend Yield 12.1% 11.5% 8.7%* (2) (1) FY21 and FY22 non-GAAP EPS growth is presented pro forma 9.8% 9.0% 8.0% 8.5% Expects Expects 6.0% midpoint of 5.3% 6.0% 6.0% (2) non-GAAP EPS growth outlook of guidance 4.0% 3.0% midpoint 4.0%-8.0% in FY2026E 2.7% 2.3% 2.6% 2.2% 2.1% 2.0% 1.9% (1) (1) FY2020 FY2021 FY2022 FY2023 FY2024 FY2025 FY2026E 1. Pro forma metrics exclude the financial impact of OpenMarket (which was divested on December 31, 2020) from fiscal year 2021. 2. Non-GAAP. See reconciliation tables in appendix Non-GAAP Diluted EPS Growth Dividend Yield Total Shareholder Return 3. Expected total shareholder return assumes Non-GAAP EPS growth plus dividend yield (based on fiscal year end closing share price); FY2026E assumed 6.0% (2) midpoint of non-GAAP EPS outlook, and dividend yield based on quarterly rate of *Non-GAAP EPS growth of 6.0%, plus 2.7% dividend yield $0.569 as of share price on 11/11/25 4. Refer to https://investors.amdocs.com/ and earnings reports issued on 11/10/2020, 11/2/2021, 11/8/2022, 11/7/2023, 11/12/2024 and 11/11/2025 for non- GAAP reconciliation in FY2020, FY2021, FY2022, FY2023, FY2024 and FY2025 Information Security Level 0 – Public. © 2026 – Proprietary & Confidential Information of Amdocs 24

Q&A Information Security Level 0 – Public. © 2026 – Proprietary & Confidential Information of Amdocs 25 25 25

Appendix Outlook & Reconciliation Tables Information Security Level 0 – Public. © 2026 – Proprietary & Confidential Information of Amdocs 26 26 26
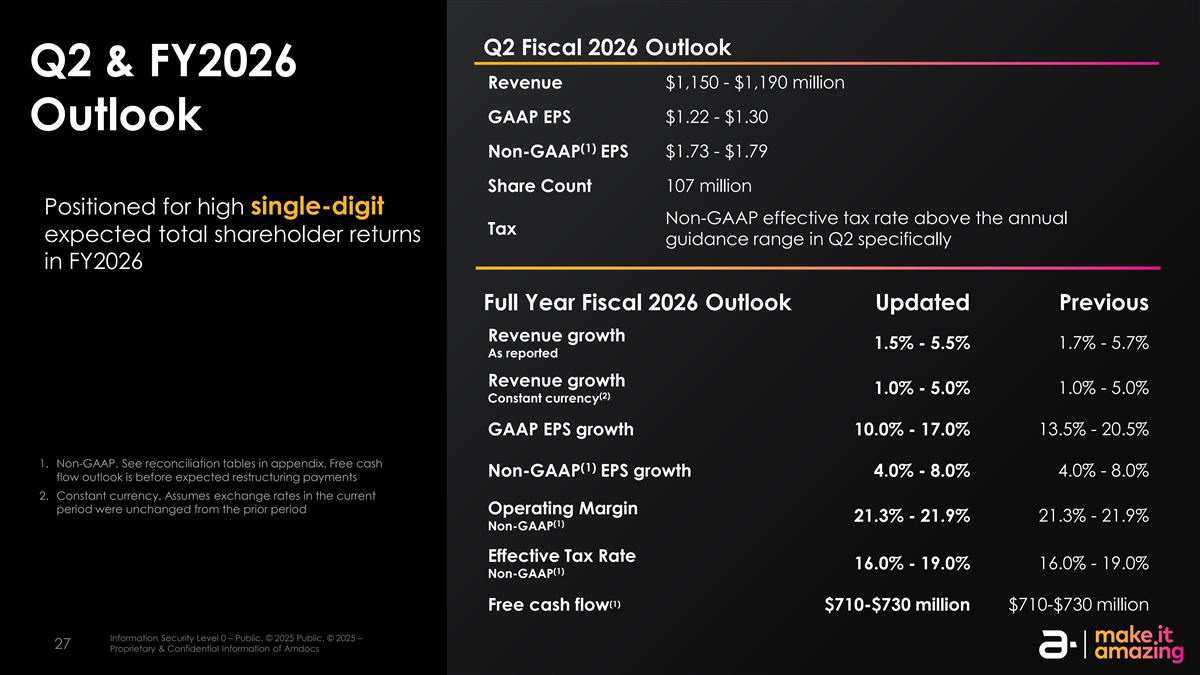
Q2 Fiscal 2026 Outlook Q2 & FY2026 Revenue $1,150 - $1,190 million $1.22 - $1.30 GAAP EPS Outlook (1) Non-GAAP EPS $1.73 - $1.79 Share Count 107 million Positioned for high single-digit Non-GAAP effective tax rate above the annual Tax expected total shareholder returns guidance range in Q2 specifically in FY2026 Full Year Fiscal 2026 Outlook Updated Previous Revenue growth 1.5% - 5.5% 1.7% - 5.7% As reported Revenue growth 1.0% - 5.0% 1.0% - 5.0% (2) Constant currency GAAP EPS growth 10.0% - 17.0% 13.5% - 20.5% 1. Non-GAAP. See reconciliation tables in appendix. Free cash (1) 4.0% - 8.0% Non-GAAP EPS growth 4.0% - 8.0% flow outlook is before expected restructuring payments 2. Constant currency. Assumes exchange rates in the current period were unchanged from the prior period Operating Margin 21.3% - 21.9% 21.3% - 21.9% (1) Non-GAAP Effective Tax Rate 16.0% - 19.0% 16.0% - 19.0% (1) Non-GAAP (1) Free cash flow $710-$730 million $710-$730 million Information Security Level 0 – Public. © 2025 Public. © 2025 – Information Security Level 0 – Public. © 2025 Public. © 2025 – Proprietary & Confidential Information of Amdocs 27 27 Proprietary & Confidential Information of Amdocs
Reconciliation Tables a) The amounts under Purchase of property and equipment, net”, include immaterial proceeds from sale of property and equipment for all periods presented. Information Security Level 0 – Public. © 2025 Public. © 2025 – Information Security Level 0 – Public. © 2025 Public. © 2025 – Proprietary & Confidential Information of Amdocs 28 28 Proprietary & Confidential Information of Amdocs
Reconciliation Tables Information Security Level 0 – Public. © 2025 Public. © 2025 – Information Security Level 0 – Public. © 2025 Public. © 2025 – Proprietary & Confidential Information of Amdocs 29 29 Proprietary & Confidential Information of Amdocs

Thank YOU