
UNITED STATES
SECURITIES AND EXCHANGE COMMISSION
WASHINGTON, D.C. 20549
Form 6-K
REPORT OF FOREIGN PRIVATE ISSUER
PURSUANT TO RULE 13a-16 OR 15d-16
OF THE SECURITIES EXCHANGE ACT OF 1934
For the month of November 2026
Commission File Number 1-14840
AMDOCS LIMITED
Hirzel House, Smith Street,
St. Peter Port, Island of Guernsey, GY1 2NG
Amdocs, Inc.
625 Maryville Centre Drive, Suite 200, Saint Louis, Missouri 63141
(Address of principal executive offices)
Indicate by check mark whether the registrant files or will file annual reports under cover of Form 20-F or Form 40-F:
FORM 20-F ☒ FORM 40-F ☐
On November 3, 2026, Amdocs Limited (“Amdocs”) issued a press release announcing financial results for the quarter ended September 30, 2026. A copy of the press release and the accompanying presentation are furnished as Exhibits 99.1 and 99.2 to this Report of Foreign Private Issuer on Form 6-K.
The information in this Form 6-K (including Exhibits 99.1 and 99.2) shall not be deemed “filed” for purposes of Section 18 of the Securities Exchange Act of 1934 (the “Exchange Act”) or otherwise subject to the liabilities of that section, nor shall it be deemed incorporated by reference in any filing under the Securities Act of 1933 or the Exchange Act.
EXHIBIT INDEX
| EXHIBIT |
DESCRIPTION | |
| 99.1 | Amdocs Limited Press Release Announcing Q4 Earnings, dated November 3, 2026 | |
| 99.2 | Fiscal Q4 2026 Earnings Presentation | |
SIGNATURES
Pursuant to the requirements of the Securities Exchange Act of 1934, the registrant has duly caused this report to be signed on its behalf by the undersigned, thereunto duly authorized.
| AMDOCS LIMITED | ||
| By: | /s/ Matthew E. Smith | |
| Matthew E. Smith | ||
| Secretary and Authorized Signatory | ||
Date: November 3, 2026
Exhibit 99.1

|

|
Amdocs Limited Reports Fourth Quarter Fiscal 2026 Results & Full Year Fiscal 2026 Results
Fiscal 2026 Revenue of $4.70 Billion, up 3.6% YoY as Reported and 3.0% YoY in
Constant Currency(1)
Announces Eight-Year Strategic aOS Agreement with AT&T
Enters the Insurance Industry Through the Acquisition of EIS
Initiates Fiscal 2027 Guidance & Fiscal 2028 Expectations:
Fiscal 2027 Revenue Outlook of (17.9%)-(14.3%) YoY as
Reported, and (11%)-(7%) in Pro Forma(2) Constant Currency(1)
Provides Fiscal 2028 Expectations for Mid-Single Digit Revenue Growth, High-Single
Digit Earnings Growth & Steadily Rising Dividend
Full Year Fiscal 2026 Highlights
(All comparisons are against prior year, unless otherwise stated)
| • | Revenue of $4,697 million, up 3.6% as reported and up 3.0% in constant currency(1) |
| • | Managed services revenue of $3,023 million, equivalent to approximately 64% of total revenue |
| • | GAAP diluted EPS of $4.68 down 7.3% including a restructuring charge of 130 cents per share; without Q4 restructuring charges GAAP diluted EPS would have been at the higher end of the guidance range of (5.0)%-(3.0)% |
| • | Non-GAAP diluted EPS of $7.41, up 6.0% and at the midpoint of the 5.5%-6.5% guidance range |
| • | Free cash flow(3) of $562 million, comprised of cash flow from operations of $673 million, less $111 million in net capital expenditures and other; excluding $167 million of restructuring payments which were not included in the full year free cash flow(3) guidance of $710-$730 million, free cash flow(3) would have been $729 million |
| 1. | Revenue on a constant currency basis assumes exchange rates in the current period were unchanged from the prior period |
| 2. | For comparison purposes, pro forma adjusts fiscal year 2026 revenue by approximately $360 million to reflect the exit of non-strategic business activities relating to the resale of hardware activities, and the divestiture of the media business; these activities substantially already ceased in the first quarter fiscal 2027 |
| 3. | Please refer to the Selected Financial Metrics tables below (figures may not sum because of rounding) |
| • | Repurchased $511 million of ordinary shares during the fiscal year |
| • | Twelve-month backlog of $3.50 billion; adjusting comparable periods for the exit of non-strategic business activities relating to the resale of hardware activities, and the divestiture of the media business, twelve-month backlog was down 9.6%(2) as compared to last year’s fourth fiscal quarter, and down approximately $370 million(2) sequentially |
Fourth Quarter Fiscal 2026 Highlights
(All comparisons are against same quarter of the prior year, unless otherwise stated)
| • | Revenue of $1,194 million, up 3.8% as reported and up 4.0% in constant currency(1); revenue was in line with the midpoint of the $1,175-$1,215 million guidance range in constant currency(1) |
| • | Managed services revenue of $728 million, equivalent to approximately 61% of total revenue and down 3% |
| • | GAAP diluted EPS of $1.35, including a restructuring charge of 22 cents per share, without which GAAP diluted EPS would have been $1.57, above the guidance range of $1.48-$1.56 |
| • | Non-GAAP diluted EPS of $1.98, slightly above the midpoint of the guidance range of $1.94-$2.00 |
| • | GAAP operating income of $189 million, including a restructuring charge of $25.3 million; GAAP operating margin of 15.8%, up 430 basis points compared to last year’s fourth quarter and up 690 basis points sequentially |
| • | Non-GAAP operating income of $257 million; non-GAAP operating margin of 21.6%, unchanged as compared to last year’s fourth fiscal quarter and unchanged sequentially |
| • | The Board of Directors (the “Board”) approved an 3% increase in the Company’s quarterly cash dividend payment from $0.569 per share to $0.586 per share, anticipated to be first paid in April 2027, subject to shareholder approval at the January 2027 annual meeting |
| • | Amdocs and T-Mobile have both issued notices to one another, asserting that the other party has materially breached one or more of the agreements pursuant to which Amdocs provides software and services to T-Mobile. Both Amdocs’ notices and T-Mobile’s notices threaten to terminate the agreement(s) and/or pursue monetary and other relief, including in arbitration. Amdocs is prepared to pursue its claims and defend itself against T-Mobile’s assertions, including in arbitration. As with any litigation, there can be no assurance as to the outcome of these matters. These circumstances have been taken into consideration in forming our conservative guidance assumptions for fiscal 2027, which reflect our best estimates as of this date, including in case of termination of our agreements with T-Mobile by either party |
JERSEY CITY, NJ - November 3, 2026 - Amdocs Limited (NASDAQ:DOX today reported operating results for the three months ended September 30, 2026.
“We delivered solid fourth quarter and full year fiscal 2026 results, consistent with our guidance, and I want to thank our employees around the world for their focus and commitment. I took over as CEO two quarters ago, and since then we have moved fast to develop a new growth strategy and are busy executing it. The core pillar of that strategy is aOS, our Agentic Operating System for telco, which is quickly gaining market traction. Today we announced a significant, eight-year strategic agreement with AT&T, our largest customer. It expands our longstanding partnership by pairing aOS with AT&T’s AI-enabled delivery framework to modernize its business and customer operations. On top of AT&T, we are also excited to announce another three major strategic aOS deals with VodafoneThree in UK, VEON in Eurasia and Globe in Philippines. Together, these deals are great examples of how aOS is enabling Amdocs to expand its activities and becoming the trusted partner of choice for our customers’ agentic journeys,” said Shimie Hortig, president and chief executive officer of Amdocs Management Limited.
Hortig continued, “We are also excited to announce our entry into a new vertical with the acquisition of EIS, a leading provider of an agentic multi-line insurance platform. This is our first step into the insurance industry. It significantly expands our addressable market and establishes insurance as a strategic medium- to long-term growth engine for Amdocs. The rationale is compelling. Insurance shares many of the characteristics that have defined our success in telecommunications: highly regulated environments, complex and mission-critical platforms, and data-intensive workflows. EIS brings an AI-native core platform, an established global customer base, and deep knowledge of both Life & Annuities and Property & Casualty. By combining EIS’ assets and deep vertical expertise, with Amdocs aOS, our scale and our accountability-driven business model, we aim to provide a differentiated offering and become their partner of choice to lead their agentic journey.”
Hortig concluded, “We believe our growing strategic momentum, expansion into the insurance market and internal transformation will position us for long-term growth and improved profitability. As part of the focus of our new strategy, we also decided to exit certain businesses and activities that aren’t strategically relevant to our agentic future, including the recently announced sale of our media business and the exit of non-strategic business activities relating to the resale of hardware activities. Looking into fiscal 2027, our guidance reflects major headwinds from T-Mobile due to a recent dispute, the completion of the integration project of the USCellular customers and reduction in T-Mobile’s discretionary spending. That said, the rest of our business remains robust and continues showing growth in fiscal 2027. Moreover, with positive market traction for aOS and an expanding pipeline of significant customer opportunities, our fiscal 2028 expectations position us for mid-single digit revenue growth, high-single digit earnings growth and a steadily rising dividend.”
Revenue
(All comparisons are against the prior year period)
| In millions | ||||||||||||||||
| Three months ended | Twelve months ended | |||||||||||||||
| September 30, 2026 | September 30, 2026 | |||||||||||||||
| Actual | Previous Guidance |
Actual | Previous Guidance |
|||||||||||||
| Revenue |
$ | 1,194 | $ | 1,175-$1,215 | $ | 4,697 | — | |||||||||
| Revenue Growth, as reported |
3.8 | % | — | 3.6 | % | 3.2%-4.0% | ||||||||||
| Revenue Growth, constant currency (1) |
4.0 | % | — | 3.0 | % | 2.6%-3.4% | ||||||||||
| • | Revenue for the fourth fiscal quarter of 2026 was in line with the midpoint of Amdocs’ guidance range in constant currency(1), and includes a $1 million negative impact from foreign currency movements compared to our guidance assumptions |
| • | Revenue for the fourth fiscal quarter includes a negative impact from foreign currency movements of $2 million relative to the fourth quarter of fiscal 2025 and a negative impact from foreign currency movements of $3 million relative to the third quarter of fiscal 2026 |
Net Income and Earnings Per Share
| In thousands, except per share data | ||||||||||||||||
| Three months ended | Twelve months ended | |||||||||||||||
| September 30, | September 30, | |||||||||||||||
| 2026 | 2025 | 2026 | 2025 | |||||||||||||
| GAAP Measures |
||||||||||||||||
| Net Income |
$ | 140,823 | $ | 97,114 | $ | 501,242 | $ | 567,769 | ||||||||
| Net Income attributable to Amdocs Limited |
$ | 139,871 | $ | 96,327 | $ | 497,421 | $ | 564,704 | ||||||||
| Diluted earnings per share |
$ | 1.35 | $ | 0.88 | $ | 4.68 | $ | 5.05 | ||||||||
| Non-GAAP Measures |
||||||||||||||||
| Non-GAAP Net Income |
$ | 206,097 | $ | 202,203 | $ | 791,669 | $ | 784,267 | ||||||||
| Non-GAAP Net Income attributable to Amdocs Limited |
$ | 205,145 | $ | 201,416 | $ | 787,848 | $ | 781,202 | ||||||||
| Non-GAAP Diluted earnings per share |
$ | 1.98 | $ | 1.83 | $ | 7.41 | $ | 6.99 | ||||||||
| • | Non-GAAP net income excludes amortization of purchased intangible assets and other acquisition-related costs, changes in certain acquisition related liabilities measured at fair value, equity-based compensation expenses, restructuring charges, and other, net of related tax effects. For further details of the reconciliation of selected financial metrics from GAAP to Non-GAAP, please refer to the tables below |
Capital Allocation & Liquidity
| • | Quarterly Cash Dividend Program: On November 3, 2026, the Board approved the Company’s next quarterly cash dividend payment at the rate of $0.569 per share, and set December 31, 2026 as the record date for determining the shareholders entitled to receive the dividend, which will be payable on January 29, 2027 |
| • | The Board also approved a 3% increase in the Company’s quarterly cash dividend payment to $0.586 per share, which is anticipated to be first paid in April 2027, provided that the increase is approved by shareholders at the January 2027 annual general meeting of shareholders |
| • | Share Repurchase Activity: Repurchased $83 million of ordinary shares during the fourth quarter of fiscal 2026 |
| • | M&A Activity: On November 3, 2026, Amdocs announced it has acquired EIS, a global insurance technology provider offering a modern, cloud-native and agentic multi-line platform spanning policy administration, billing, claims and customer engagement, for consideration of approximately $340 million in cash. Additional consideration may be paid later based on the achievement of certain performance metrics |
| • | Financing Arrangements: In October 2026, Amdocs secured two term loans, for an aggregate amount of $500 million |
Twelve-month Backlog
| • | Twelve-month backlog was $3.50 billion at the end of the fourth quarter of fiscal 2026. On a pro forma(2) basis, adjusting comparable periods for the exit of non-strategic business activities relating to the resale of hardware activities, and the divestiture of the media business, twelve-month backlog was down approximately 9.6% as compared to last year’s fourth fiscal quarter. |
| • | Twelve-month backlog includes anticipated revenue related to contracts, estimated revenue from managed services contracts, letters of intent, maintenance and estimated on-going support activities. |
First Quarter Fiscal 2027 Outlook
| In millions | ||
| except per share data | ||
| Q1 2027 | ||
| Revenue |
$955-$995 | |
| GAAP Diluted earnings per share |
$0.81-$0.89 | |
| Non-GAAP Diluted earnings per share |
$1.27-$1.33 |
| • | First quarter revenue guidance assumes a positive $1 million sequential impact from foreign currency fluctuations as compared to the fourth quarter of fiscal 2026 |
| • | GAAP diluted EPS guidance does not include: the impact of future restructuring charges; the impact of the acquisition of EIS; and the impact of the divestiture of Vubiquity |
| • | First quarter non-GAAP diluted EPS guidance excludes primarily equity-based compensation expense of approximately $0.24-$0.26 per share, amortization of purchased intangible assets and other acquisition-related costs of approximately $0.17 per share, changes in certain acquisitions related liabilities measured at fair value, and other, net of related tax effects. |
Full Year Fiscal 2027 Outlook
| Year-over-Year growth | ||
| FY 2027 | ||
| Revenue Growth, as reported |
(17.9%)-(14.3%) | |
| Revenue growth, pro forma(2) constant currency(1) |
(11%)-(7%) | |
| GAAP Diluted earnings per share |
(25%)-(17%) | |
| Non-GAAP Diluted earnings per share |
(30%)-(26%) | |
| In millions | ||
| FY 2027 | ||
| Free Cash Flow (3) |
$440-$500 | |
| • | Full year fiscal 2027 revenue guidance takes into consideration best estimates to reflect the legal dispute with T-Mobile as of this date, including in case of termination of agreements with T-Mobile by either party |
| • | Full year fiscal 2027 revenue guidance incorporates an expected negative impact from foreign currency fluctuations of approximately 0.1% year-over-year, and includes some inorganic contribution, including the acquisition of EIS |
| • | Revenue growth on a pro forma(2) constant currency(1) basis adjusts fiscal 2026 revenue by approximately $360 million to reflect the exit of non-strategic business activities relating to the resale of hardware activities, and the divestiture of the media business; these actions were substantially already taken in the first quarter of fiscal 2027 |
| • | GAAP diluted EPS guidance does not include: the impact of future restructuring charges; the impact of the acquisition of EIS; and the impact of the divestiture of Vubiquity |
| • | Non-GAAP diluted earnings per share growth excludes primarily equity-based compensation expense of approximately $0.84-$0.92 per share, amortization of purchased intangible assets and other acquisition-related costs of approximately $0.61 per share, changes in certain acquisitions related liabilities measured at fair value, and other, net of related tax effects |
| • | Non-GAAP operating margin is anticipated to be within a range of 19.2% to 19.8% for the full year fiscal 2027 |
| • | Non-GAAP operating margin is comprised of GAAP operating margin, excluding amortization of purchased intangible assets and other, equity-based compensation expense, restructuring charges, and changes in certain acquisitions related liabilities measured at fair value |
| • | Non-GAAP effective tax rate is anticipated to be within a range of 16% to 19% for the full year fiscal 2027 |
| • | Full year fiscal 2027 free cash flow(3) of $440-$500 million, excluding payments related to restructuring charges; free cash flow(3) is comprised of cash flow from operations, less net capital expenditures |
The forward-looking statements regarding our first fiscal quarter 2027 and full year fiscal 2027 guidance take into consideration the Company’s current expectations regarding macroeconomic, geopolitical and industry specific risks and various uncertainties and certain assumptions, some of which we will discuss on our earnings conference call. However, we note that market dynamics continue to shift rapidly and we cannot predict all possible outcomes, including those resulting from certain geopolitical events, the current inflationary environment, changes to trade policies including tariffs and trade restrictions and the resulting impact on economic activities (as our outlook assumes current economic conditions do not deteriorate significantly due to trade policy or other macro factors) global or regional events, and the prevailing level of macro-economic, business and operational uncertainty, including customer spending behavior which have created, and continue to create, a significant amount of uncertainty, or from current and potential customer consolidation or their other strategic corporate activities. In particular, our guidance makes assumptions about our relationship with T-Mobile, and actual developments could vary materially, including due to the results of any potential proceeding or settlement thereof. See “Forward-Looking Statements” below.
Conference Call and Earnings Webcast Presentation Details
Amdocs will host a conference call and earnings webcast presentation on November 3, 2026 at 5:00 p.m. Eastern Time to discuss the Company’s fourth quarter of fiscal 2026 results. To participate in the call, please register here to receive the dial-in numbers and unique access PIN. The conference call and webcast will also be carried live on the Internet and may be accessed via the Amdocs website at https://investors.amdocs.com. Presentation slides will be available shortly before the webcast.
Non-GAAP Financial Measures
This release includes non-GAAP financial measures, including non-GAAP diluted earnings per share, free cash flow(3), revenue on a constant currency(1) basis, non-GAAP cost of revenue, non-GAAP research and development, non-GAAP selling, general and administrative, non-GAAP operating income, non-GAAP operating margin, non-GAAP interest and other expenses, net, non-GAAP income taxes, non-GAAP effective tax rate, non-GAAP net income, non-GAAP net income attributable to Amdocs Limited and non-GAAP diluted earnings per share growth. These other non-GAAP measures exclude the following items:
| • | Amortization of purchased intangible assets and other acquisition-related costs; |
| • | Changes in certain acquisition-related liabilities measured at fair value; |
| • | Restructuring and unusual charges or benefits; |
| • | Equity-based compensation expense; |
| • | Other; and |
| • | Tax effects related to the above. |
Free cash flow(3) equals cash generated by operating activities less net capital expenditures. These non-GAAP financial measures are not in accordance with, or an alternative for, generally accepted accounting principles and may be different from non-GAAP financial measures used by other companies. In addition, these non-GAAP financial measures are not based on any comprehensive set of accounting rules or principles. Amdocs believes that non-GAAP financial measures have limitations in that they do not reflect all of the amounts associated with Amdocs’ results of operations as determined in accordance with GAAP and that these measures should only be used to evaluate Amdocs’ results of operations in conjunction with the corresponding GAAP measures.
Amdocs believes that the presentation of non-GAAP financial measures, including non-GAAP diluted earnings per share, free cash flow(2), revenue on a constant currency(1) basis, non-GAAP cost of revenue, non-GAAP research and development, non-GAAP selling, general and administrative, non-GAAP operating income, non-GAAP operating margin, non-GAAP interest and other expenses, net, non-GAAP income taxes, non-GAAP effective tax rate, non-GAAP net income, non-GAAP net income attributable to Amdocs Limited and non-GAAP diluted earnings per share growth when shown in conjunction with the corresponding GAAP measures, provides useful information to investors and management regarding financial and business trends relating to its financial condition and results of operations, as well as the net amount of cash generated by its business operations after taking into account capital spending required to maintain or expand the business.
For its internal budgeting process and in monitoring the results of the business, Amdocs’ management uses financial statements that do not include amortization of purchased intangible assets and other acquisition-related costs, changes in certain acquisition related liabilities measured at fair value, restructuring and unusual charges or benefits, equity-based compensation expense, other and related tax effects. Amdocs’ management also uses the foregoing non-GAAP financial measures, in addition to the corresponding GAAP measures, in reviewing the financial results of Amdocs. In addition, Amdocs believes that significant groups of investors exclude these items in reviewing its results and those of its competitors, because the amounts of the items between companies can vary greatly depending on the assumptions used by an individual company in determining the amounts of the items.
Amdocs further believes that, where the adjustments used in calculating non-GAAP diluted earnings per share are based on specific, identified amounts that impact different line items in the Consolidated Statements of Income (including cost of revenue, research and development, selling, general and administrative, operating income, interest and other expenses, net, income taxes and net income), it is useful to investors to understand how these specific line items in the Consolidated Statements of Income are affected by these adjustments. Please refer to the Reconciliation of Selected Financial Metrics from GAAP to Non-GAAP tables below.
Supporting Resources
| • | Keep up with Amdocs news by visiting the Company’s website |
| • | Follow us on X, Facebook, LinkedIn and YouTube |
About Amdocs
Amdocs develops, transforms and operates the mission-critical systems that businesses depend on every day. With more than 40 years of experience serving the world’s leading communications companies, we combine proprietary technology, deep industry expertise and end-to-end accountability, from transformation through ongoing operations and evolution. Powered by aOS, our agentic operating system, we bring industry-specific AI into core business processes, advancing customers toward intelligent, increasingly autonomous operations across business, IT and network domains. We enable customers to modernize complex systems in highly regulated environments while maintaining the reliability, security and scale their businesses demand, driving measurable improvements in customer experience, operational efficiency and revenue growth.
Amdocs runs billions of transactions daily, and our technology is relied on every day. Together, we help those who shape the future to make it amazing. Amdocs is listed on the NASDAQ Global Select Market (NASDAQ: DOX) and reported revenue of $4.7 billion in fiscal 2026. For more information, visit www.amdocs.com.
Forward-Looking Statements
This press release includes information that constitutes forward-looking statements made pursuant to the safe harbor provision of the Private Securities Litigation Reform Act of 1995, including statements about Amdocs’ strategy, including with respect to artificial intelligence and agentic opportunities, growth, financial outlook, and business results in future quarters and years. Although we believe the expectations reflected in such forward-looking statements are based upon reasonable assumptions, we can give no
assurance that our expectations will be obtained or that any deviations will not be material. Such statements involve risks, uncertainties, and other important factors that may cause future results to differ materially from those anticipated. These risks include, but are not limited to, the effects of general macroeconomic conditions, prevailing level of macroeconomic, business and operational uncertainty, including as a result of geopolitical events or other regional events or pandemics, changes to trade policies including tariffs and trade restrictions, as well as the current inflationary environment, and the effects of these conditions on the Company’s customers’ businesses and levels of business activity, including the effect of the current economic uncertainty and industry pressure on the spending decisions of the Company’s customers, Amdocs’ ability to grow in the business markets that it serves, Amdocs’ ability to successfully integrate acquired businesses, adverse effects of market competition, rapid technological shifts that may render the Company’s products and services obsolete, security incidents, including breaches and cyber attacks to our systems and networks and those of our partners or customers, potential loss of a major customer, our ability to develop long-term relationships with our customers, continued developments with T-Mobile including potential arbitration and loss of revenue from their contracts, our ability to successfully and effectively implement artificial intelligence and Generative AI in the Company’s offerings and operations, and risks associated with operating businesses in the international market. Amdocs may elect to update these forward-looking statements at some point in the future; however, Amdocs specifically disclaims any obligation to do so. These and other risks are discussed at greater length in Amdocs’ filings with the Securities and Exchange Commission, including in our Annual Report on Form 20-F for the fiscal year ended September 30, 2025, filed on December 15, 2025, and our Form 6-K furnished for the first quarter of fiscal 2026 on February 17, 2026, for the second quarter of fiscal 2026 on May 26, 2026 and for the third quarter of fiscal 2026 on August 18, 2026.
Contact:
Matthew Smith
Head of Investor Relations
Amdocs
314-212-8328
E-mail: dox_info@amdocs.com
AMDOCS LIMITED
Consolidated Statements of Income
(In thousands, except per share data)
| Three months ended September 30, |
Fiscal year ended September 30, |
|||||||||||||||
| 2026 | 2025 | 2026 | 2025 | |||||||||||||
| Revenue |
$ | 1,193,769 | $ | 1,150,218 | $ | 4,696,582 | $ | 4,532,913 | ||||||||
| Operating expenses: |
||||||||||||||||
| Cost of revenue |
754,156 | 719,878 | 2,906,352 | 2,811,333 | ||||||||||||
| Research and development |
80,114 | 87,865 | 335,460 | 340,845 | ||||||||||||
| Selling, general and administrative |
123,872 | 121,807 | 540,522 | 506,108 | ||||||||||||
| Amortization of purchased intangible assets and other |
21,412 | 14,287 | 77,828 | 62,424 | ||||||||||||
| Restructuring charges |
25,346 | 73,756 | 153,476 | 80,539 | ||||||||||||
|
|
|
|
|
|
|
|
|
|||||||||
| 1,004,900 | 1,017,593 | 4,013,638 | 3,801,249 | |||||||||||||
|
|
|
|
|
|
|
|
|
|||||||||
| Operating income |
188,869 | 132,625 | 682,944 | 731,664 | ||||||||||||
| Interest and other expense, net |
(15,867 | ) | (11,843 | ) | (47,177 | ) | (38,422 | ) | ||||||||
|
|
|
|
|
|
|
|
|
|||||||||
| Income before income taxes |
173,002 | 120,782 | 635,767 | 693,242 | ||||||||||||
| Income taxes |
32,179 | 23,668 | 134,525 | 125,473 | ||||||||||||
|
|
|
|
|
|
|
|
|
|||||||||
| Net income |
$ | 140,823 | $ | 97,114 | $ | 501,242 | $ | 567,769 | ||||||||
|
|
|
|
|
|
|
|
|
|||||||||
| Net income attributable to noncontrolling interests |
952 | 787 | 3,821 | 3,065 | ||||||||||||
|
|
|
|
|
|
|
|
|
|||||||||
| Net income attributable to Amdocs Limited |
$ | 139,871 | $ | 96,327 | $ | 497,421 | $ | 564,704 | ||||||||
|
|
|
|
|
|
|
|
|
|||||||||
| Basic earnings per share attributable to Amdocs Limited |
$ | 1.35 | $ | 0.88 | $ | 4.69 | $ | 5.08 | ||||||||
|
|
|
|
|
|
|
|
|
|||||||||
| Diluted earnings per share attributable to Amdocs Limited |
$ | 1.35 | $ | 0.88 | $ | 4.68 | $ | 5.05 | ||||||||
|
|
|
|
|
|
|
|
|
|||||||||
| Basic weighted average number of shares outstanding |
103,282 | 109,279 | 105,947 | 111,147 | ||||||||||||
|
|
|
|
|
|
|
|
|
|||||||||
| Diluted weighted average number of shares outstanding |
103,494 | 109,853 | 106,288 | 111,746 | ||||||||||||
|
|
|
|
|
|
|
|
|
|||||||||
| Cash dividends declared per share |
$ | 0.569 | $ | 0.527 | $ | 2.234 | $ | 2.060 | ||||||||
|
|
|
|
|
|
|
|
|
|||||||||
AMDOCS LIMITED
Selected Financial Metrics
(In thousands, except per share data)
| Three months ended September 30, |
Fiscal year ended September 30, |
|||||||||||||||
| 2026 | 2025 | 2026 | 2025 | |||||||||||||
| Revenue |
$ | 1,193,769 | $ | 1,150,218 | $ | 4,696,582 | $ | 4,532,913 | ||||||||
| Non-GAAP operating income |
257,268 | 248,118 | 1,012,452 | 968,330 | ||||||||||||
| Non-GAAP net income |
206,097 | 202,203 | 791,669 | 784,267 | ||||||||||||
| Non-GAAP net income attributable to Amdocs Limited |
205,145 | 201,416 | 787,848 | 781,202 | ||||||||||||
| Non-GAAP diluted earnings per share |
$ | 1.98 | $ | 1.83 | $ | 7.41 | $ | 6.99 | ||||||||
| Diluted weighted average number of shares outstanding |
103,494 | 109,853 | 106,288 | 111,746 | ||||||||||||
Free Cash Flows
(In thousands)
| Three months ended September 30, |
Fiscal year ended September 30, |
|||||||||||||||
| 2026 | 2025 | 2026 | 2025 | |||||||||||||
| Net Cash Provided by Operating Activities |
$ | 153,740 | $ | 229,840 | $ | 672,723 | $ | 749,096 | ||||||||
| Purchases of property and equipment, net (a) |
(31,759 | ) | (31,212 | ) | (110,528 | ) | (103,952 | ) | ||||||||
|
|
|
|
|
|
|
|
|
|||||||||
| Free Cash Flow |
$ | 121,981 | $ | 198,628 | $ | 562,195 | $ | 645,144 | ||||||||
| (a) | The amounts under “Purchase of property and equipment, net”, include immaterial proceeds from sale of property and equipment. |
AMDOCS LIMITED
Reconciliation of Selected Financial Metrics from GAAP to Non-GAAP
(In thousands)
| Three Months Ended September 30, 2026 | ||||||||||||||||||||||||||||||||
| GAAP | Amortization of purchased intangible assets and other |
Equity based compensation expense |
Changes in certain acquisitions related liabilities measured at fair value |
Restructuring charges |
Other | Tax effect |
Non-GAAP | |||||||||||||||||||||||||
| Operating expenses: |
||||||||||||||||||||||||||||||||
| Cost of revenue |
$ | 754,156 | $ | — | $ | (10,420 | ) | $ | (135 | ) | $ | — | $ | — | $ | — | $ | 743,601 | ||||||||||||||
| Research and development |
80,114 | (1,919 | ) | 78,195 | ||||||||||||||||||||||||||||
| Selling, general and administrative |
123,872 | (9,032 | ) | (135 | ) | 114,705 | ||||||||||||||||||||||||||
| Amortization of purchased intangible assets and other |
21,412 | (21,412 | ) | — | ||||||||||||||||||||||||||||
| Restructuring charges |
25,346 | (25,346 | ) | — | ||||||||||||||||||||||||||||
|
|
|
|
|
|
|
|
|
|
|
|
|
|
|
|
|
|||||||||||||||||
| Total operating expenses |
1,004,900 | (21,412 | ) | (21,371 | ) | (270 | ) | (25,346 | ) | — | — | 936,501 | ||||||||||||||||||||
|
|
|
|
|
|
|
|
|
|
|
|
|
|
|
|
|
|||||||||||||||||
| Operating income |
188,869 | 21,412 | 21,371 | 270 | 25,346 | 257,268 | ||||||||||||||||||||||||||
| Interest and other expense, net |
(15,867 | ) | 2,106 | (13,761 | ) | |||||||||||||||||||||||||||
| Income taxes |
32,179 | 5,231 | 37,410 | |||||||||||||||||||||||||||||
|
|
|
|
|
|
|
|
|
|
|
|
|
|
|
|
|
|||||||||||||||||
| Net income |
140,823 | 21,412 | 21,371 | 270 | 25,346 | 2,106 | (5,231 | ) | 206,097 | |||||||||||||||||||||||
|
|
|
|
|
|
|
|
|
|
|
|
|
|
|
|
|
|||||||||||||||||
| Net income attributable to noncontrolling interests |
952 | 952 | ||||||||||||||||||||||||||||||
|
|
|
|
|
|
|
|
|
|
|
|
|
|
|
|
|
|||||||||||||||||
| Net income attributable to Amdocs Limited |
$ | 139,871 | $ | 21,412 | $ | 21,371 | $ | 270 | $ | 25,346 | $ | 2,106 | $ | (5,231 | ) | $ | 205,145 | |||||||||||||||
|
|
|
|
|
|
|
|
|
|
|
|
|
|
|
|
|
|||||||||||||||||
| Three Months Ended September 30, 2025 | ||||||||||||||||||||||||||||||||
| GAAP | Amortization of purchased intangible assets and other |
Equity based compensation expense |
Changes in certain acquisitions related liabilities measured at fair value |
Restructuring charges |
Other | Tax effect |
Non-GAAP | |||||||||||||||||||||||||
| Operating expenses: |
||||||||||||||||||||||||||||||||
| Cost of revenue |
$ | 719,878 | $ | — | $ | (13,062 | ) | $ | (360 | ) | $ | — | $ | — | $ | — | $ | 706,456 | ||||||||||||||
| Research and development |
87,865 | (2,600 | ) | 85,265 | ||||||||||||||||||||||||||||
| Selling, general and administrative |
121,807 | (11,068 | ) | (360 | ) | 110,379 | ||||||||||||||||||||||||||
| Amortization of purchased intangible assets and other |
14,287 | (14,287 | ) | — | ||||||||||||||||||||||||||||
| Restructuring charges |
73,756 | (73,756 | ) | — | ||||||||||||||||||||||||||||
|
|
|
|
|
|
|
|
|
|
|
|
|
|
|
|
|
|||||||||||||||||
| Total operating expenses |
1,017,593 | (14,287 | ) | (26,730 | ) | (720 | ) | (73,756 | ) | — | — | 902,100 | ||||||||||||||||||||
|
|
|
|
|
|
|
|
|
|
|
|
|
|
|
|
|
|||||||||||||||||
| Operating income |
132,625 | 14,287 | 26,730 | 720 | 73,756 | 248,118 | ||||||||||||||||||||||||||
| Interest and other expense, net |
(11,843 | ) | 1,545 | (10,298 | ) | |||||||||||||||||||||||||||
| Income taxes |
23,668 | 11,949 | 35,617 | |||||||||||||||||||||||||||||
|
|
|
|
|
|
|
|
|
|
|
|
|
|
|
|
|
|||||||||||||||||
| Net income |
97,114 | 14,287 | 26,730 | 720 | 73,756 | 1,545 | (11,949 | ) | 202,203 | |||||||||||||||||||||||
|
|
|
|
|
|
|
|
|
|
|
|
|
|
|
|
|
|||||||||||||||||
| Net income attributable to noncontrolling interests |
787 | 787 | ||||||||||||||||||||||||||||||
|
|
|
|
|
|
|
|
|
|
|
|
|
|
|
|
|
|||||||||||||||||
| Net income attributable to Amdocs Limited |
$ | 96,327 | $ | 14,287 | $ | 26,730 | $ | 720 | $ | 73,756 | $ | 1,545 | $ | (11,949 | ) | $ | 201,416 | |||||||||||||||
|
|
|
|
|
|
|
|
|
|
|
|
|
|
|
|
|
|||||||||||||||||
AMDOCS LIMITED
Reconciliation of Selected Financial Metrics from GAAP to Non-GAAP
(In thousands)
| Fiscal year ended September 30, 2026 | ||||||||||||||||||||||||||||||||
| GAAP | Amortization of purchased intangible assets and other |
Equity based compensation expense |
Changes in certain acquisitions related liabilities measured at fair value |
Restructuring charges |
Other | Tax effect |
Non-GAAP | |||||||||||||||||||||||||
| Operating expenses: |
||||||||||||||||||||||||||||||||
| Cost of revenue |
$ | 2,906,352 | $ | — | $ | (43,191 | ) | $ | (763 | ) | $ | — | $ | — | $ | — | $ | 2,862,398 | ||||||||||||||
| Research and development |
335,460 | (7,642 | ) | 327,818 | ||||||||||||||||||||||||||||
| Selling, general and administrative |
540,522 | (54,230 | ) | 7,622 | 493,914 | |||||||||||||||||||||||||||
| Amortization of purchased intangible assets and other |
77,828 | (77,828 | ) | — | ||||||||||||||||||||||||||||
| Restructuring charges |
153,476 | (153,476 | ) | — | ||||||||||||||||||||||||||||
|
|
|
|
|
|
|
|
|
|
|
|
|
|
|
|
|
|||||||||||||||||
| Total operating expenses |
4,013,638 | (77,828 | ) | (105,063 | ) | 6,859 | (153,476 | ) | 3,684,130 | |||||||||||||||||||||||
|
|
|
|
|
|
|
|
|
|
|
|
|
|
|
|
|
|||||||||||||||||
| Operating income |
682,944 | 77,828 | 105,063 | (6,859 | ) | 153,476 | 1,012,452 | |||||||||||||||||||||||||
| Interest and other expense, net |
(47,177 | ) | (4,069 | ) | (51,246 | ) | ||||||||||||||||||||||||||
| Income taxes |
134,525 | 35,012 | 169,537 | |||||||||||||||||||||||||||||
|
|
|
|
|
|
|
|
|
|
|
|
|
|
|
|
|
|||||||||||||||||
| Net income |
501,242 | 77,828 | 105,063 | (6,859 | ) | 153,476 | (4,069 | ) | (35,012 | ) | 791,669 | |||||||||||||||||||||
|
|
|
|
|
|
|
|
|
|
|
|
|
|
|
|
|
|||||||||||||||||
| Net income attributable to noncontrolling interests |
3,821 | 3,821 | ||||||||||||||||||||||||||||||
|
|
|
|
|
|
|
|
|
|
|
|
|
|
|
|
|
|||||||||||||||||
| Net income attributable to Amdocs Limited |
$ | 497,421 | $ | 77,828 | $ | 105,063 | $ | (6,859 | ) | $ | 153,476 | $ | (4,069 | ) | $ | (35,012 | ) | $ | 787,848 | |||||||||||||
|
|
|
|
|
|
|
|
|
|
|
|
|
|
|
|
|
|||||||||||||||||
| Fiscal year ended September 30, 2025 | ||||||||||||||||||||||||||||||||
| GAAP | Amortization of purchased intangible assets and other |
Equity based compensation expense |
Changes in certain acquisitions related liabilities measured at fair value |
Restructuring charges |
Other | Tax effect |
Non-GAAP | |||||||||||||||||||||||||
| Operating expenses: |
||||||||||||||||||||||||||||||||
| Cost of revenue |
$ | 2,811,333 | $ | — | $ | (51,320 | ) | $ | (1,081 | ) | $ | — | $ | — | $ | — | $ | 2,758,932 | ||||||||||||||
| Research and development |
340,845 | (9,603 | ) | 331,242 | ||||||||||||||||||||||||||||
| Selling, general and administrative |
506,108 | (43,941 | ) | 12,242 | 474,409 | |||||||||||||||||||||||||||
| Amortization of purchased intangible assets and other |
62,424 | (62,424 | ) | — | ||||||||||||||||||||||||||||
| Restructuring charges |
80,539 | (80,539 | ) | — | ||||||||||||||||||||||||||||
|
|
|
|
|
|
|
|
|
|
|
|
|
|
|
|
|
|||||||||||||||||
| Total operating expenses |
3,801,249 | (62,424 | ) | (104,864 | ) | 11,161 | (80,539 | ) | 3,564,583 | |||||||||||||||||||||||
|
|
|
|
|
|
|
|
|
|
|
|
|
|
|
|
|
|||||||||||||||||
| Operating income |
731,664 | 62,424 | 104,864 | (11,161 | ) | 80,539 | 968,330 | |||||||||||||||||||||||||
| Interest and other expense, net |
(38,422 | ) | 7,524 | (30,898 | ) | |||||||||||||||||||||||||||
| Income taxes |
125,473 | 27,692 | 153,165 | |||||||||||||||||||||||||||||
|
|
|
|
|
|
|
|
|
|
|
|
|
|
|
|
|
|||||||||||||||||
| Net income |
567,769 | 62,424 | 104,864 | (11,161 | ) | 80,539 | 7,524 | (27,692 | ) | 784,267 | ||||||||||||||||||||||
|
|
|
|
|
|
|
|
|
|
|
|
|
|
|
|
|
|||||||||||||||||
| Net income attributable to noncontrolling interests |
3,065 | 3,065 | ||||||||||||||||||||||||||||||
|
|
|
|
|
|
|
|
|
|
|
|
|
|
|
|
|
|||||||||||||||||
| Net income attributable to Amdocs Limited |
$ | 564,704 | $ | 62,424 | $ | 104,864 | $ | (11,161 | ) | $ | 80,539 | $ | 7,524 | $ | (27,692 | ) | $ | 781,202 | ||||||||||||||
|
|
|
|
|
|
|
|
|
|
|
|
|
|
|
|
|
|||||||||||||||||
AMDOCS LIMITED
Condensed Consolidated Balance Sheets
(In thousands)
| As of | ||||||||
| September 30, 2026 |
September 30, 2025 |
|||||||
| ASSETS |
||||||||
| Current assets: |
||||||||
| Cash and cash equivalents |
$ | 197,049 | $ | 324,999 | ||||
| Accounts receivable, net, including unbilled |
1,091,475 | 935,751 | ||||||
| Prepaid expenses and other current assets |
328,226 | 331,387 | ||||||
|
|
|
|
|
|||||
| Total current assets |
1,616,750 | 1,592,137 | ||||||
| Property and equipment, net |
734,051 | 768,557 | ||||||
| Lease assets |
151,469 | 182,088 | ||||||
| Goodwill and other intangible assets, net |
3,241,526 | 3,046,962 | ||||||
| Other noncurrent assets |
654,841 | 660,086 | ||||||
|
|
|
|
|
|||||
| Total assets |
$ | 6,398,637 | $ | 6,249,830 | ||||
|
|
|
|
|
|||||
| LIABILITIES AND SHAREHOLDERS’ EQUITY |
||||||||
| Current liabilities |
||||||||
| Accounts payable, accruals and other |
$ | 1,253,278 | $ | 1,201,206 | ||||
| Short-term financing arrangements |
299,461 | — | ||||||
| Lease liabilities |
32,167 | 38,725 | ||||||
| Deferred revenue |
135,005 | 118,861 | ||||||
|
|
|
|
|
|||||
| Total current liabilities |
1,719,911 | 1,358,792 | ||||||
| Lease liabilities |
114,255 | 140,776 | ||||||
| Long-term debt, net of unamortized debt issuance costs |
647,527 | 646,901 | ||||||
| Other noncurrent liabilities |
582,988 | 632,681 | ||||||
| Total Amdocs Limited Shareholders’ equity |
3,292,021 | 3,429,453 | ||||||
| Noncontrolling interests |
41,935 | 41,227 | ||||||
|
|
|
|
|
|||||
| Total equity |
3,333,956 | 3,470,680 | ||||||
|
|
|
|
|
|||||
| Total liabilities and equity |
$ | 6,398,637 | $ | 6,249,830 | ||||
|
|
|
|
|
|||||
AMDOCS LIMITED
Consolidated Statements of Cash Flows
(In thousands)
| 2026 | 2025 | |||||||
| Cash Flow from Operating Activities: |
||||||||
| Net income |
$ | 501,242 | $ | 567,769 | ||||
| Reconciliation of net income to net cash provided by operating activities: |
||||||||
| Depreciation, amortization and impairment |
210,357 | 195,435 | ||||||
| Amortization of debt issuance cost |
626 | 608 | ||||||
| Equity-based compensation expense |
105,063 | 104,864 | ||||||
| Deferred income taxes |
35,497 | 20,291 | ||||||
| Loss from short-term interest-bearing investments |
— | 3,487 | ||||||
| Net changes in operating assets and liabilities, net of amounts acquired: |
||||||||
| Accounts receivable, net |
(193,360 | ) | 79,606 | |||||
| Prepaid expenses and other current assets |
(9,656 | ) | (55,061 | ) | ||||
| Other noncurrent assets |
33,247 | (15,445 | ) | |||||
| Lease assets and liabilities, net |
(2,459 | ) | 3,221 | |||||
| Accounts payable, accrued expenses and accrued personnel |
61,013 | (77,041 | ) | |||||
| Deferred revenue |
1,000 | 8,172 | ||||||
| Income taxes payable, net |
(2,335 | ) | (15,109 | ) | ||||
| Other noncurrent liabilities |
(67,512 | ) | (71,701 | ) | ||||
|
|
|
|
|
|||||
| Net cash provided by operating activities |
672,723 | 749,096 | ||||||
|
|
|
|
|
|||||
| Cash Flow from Investing Activities: |
||||||||
| Purchase of property and equipment, net (a) |
(110,528 | ) | (103,952 | ) | ||||
| Proceeds from sale of short-term interest-bearing investments |
— | 169,993 | ||||||
| Net cash paid for business and intangible assets acquisitions |
(218,644 | ) | (86,317 | ) | ||||
| Net cash from equity investments and other |
14,101 | 18,215 | ||||||
|
|
|
|
|
|||||
| Net cash used in investing activities |
(315,071 | ) | (2,061 | ) | ||||
|
|
|
|
|
|||||
| Cash Flow from Financing Activities: |
||||||||
| Repurchase of shares |
(510,508 | ) | (551,340 | ) | ||||
| Proceeds from employee stock option exercises |
6,980 | 21,294 | ||||||
| Payments of dividends |
(233,691 | ) | (224,394 | ) | ||||
| Distribution to noncontrolling interests |
(3,113 | ) | (4,039 | ) | ||||
| Borrowings under financing arrangements |
300,000 | — | ||||||
| Payment of contingent consideration and deferred payment of business acquisitions |
(45,270 | ) | (9,642 | ) | ||||
|
|
|
|
|
|||||
| Net cash used in financing activities |
(485,602 | ) | (768,121 | ) | ||||
|
|
|
|
|
|||||
| Net decrease in cash and cash equivalents |
(127,950 | ) | (21,086 | ) | ||||
| Cash and cash equivalents at beginning of year |
324,999 | 346,085 | ||||||
|
|
|
|
|
|||||
| Cash and cash equivalents at end of year |
$ | 197,049 | $ | 324,999 | ||||
|
|
|
|
|
|||||
| (a) | The amounts under “Purchase of property and equipment, net”, include immaterial proceeds from sale of property and equipment. |
AMDOCS LIMITED
Supplementary Information
(In millions)
| Three months ended | ||||||||||||||||||||
| September 30, | June 30, | March 31, | December 31, | September 30, | ||||||||||||||||
| 2026 | 2026 | 2026 | 2025 | 2025 | ||||||||||||||||
| North America |
$ | 733.9 | $ | 748.1 | $ | 754.3 | $ | 764.7 | $ | 762.4 | ||||||||||
| Europe |
$ | 192.6 | 193.5 | 191.8 | 181.7 | 179.8 | ||||||||||||||
| Rest of the World |
267.3 | 233.3 | 225.8 | 209.5 | 208.0 | |||||||||||||||
|
|
|
|
|
|
|
|
|
|
|
|||||||||||
| Total Revenue |
$ | 1,193.8 | $ | 1,174.9 | $ | 1,172.0 | $ | 1,155.9 | $ | 1,150.2 | ||||||||||
|
|
|
|
|
|
|
|
|
|
|
|||||||||||
| Three months ended | ||||||||||||||||||||
| September 30, | June 30, | March 31, | December 31, | September 30, | ||||||||||||||||
| 2026 | 2026 | 2026 | 2025 | 2025 | ||||||||||||||||
| Managed Services Revenue |
$ | 728 | $ | 791 | $ | 759 | $ | 746 | $ | 748 | ||||||||||
|
|
|
|
|
|
|
|
|
|
|
|||||||||||
| As of | ||||||||||||||||||||
| September 30, | June 30, | March 31, | December 31, | September 30, | ||||||||||||||||
| 2026 | 2026 | 2026 | 2025 | 2025 | ||||||||||||||||
| 12-Month Backlog |
$ | 3,500 | $ | 4,260 | $ | 4,280 | $ | 4,250 | $ | 4,190 | ||||||||||
|
|
|
|
|
|
|
|
|
|
|
|||||||||||
# # #
SOURCE: Amdocs Management Limited

Amdocs Limited NASDAQ: DOX Fiscal Q4 2026 Earnings Presentation November 3, 2026 Shimie Hortig President & Chief Executive Officer Tal Rozenfeld Chief Financial Officer Exhibit 99.2
Forward-Looking Statement The information contained herein in this presentation or delivered or to be delivered to you during this presentation does not constitute an offer, expressed or implied, or a recommendation to do any transaction in Amdocs Limited securities or in any securities of its affiliates or subsidiaries. This presentation and the comments made by members of Amdocs management in conjunction with it can be found on the Investor Relations section of our website, and, as always, a copy of today’s prepared remarks will also be posted immediately following the conclusion of this call. This presentation includes information that constitutes forward-looking statements made pursuant to the safe harbor provision of the Private Securities Litigation Reform Act of 1995, including statements about Amdocs’ strategy, including with respect to artificial intelligence and agentic opportunities, growth, financial outlook and business results in future quarters and years. Although we believe the expectations reflected in such forward-looking statements are based upon reasonable assumptions, we can give no assurance that our expectations will be obtained or that any deviations will not be material. Such statements involve risks, uncertainties and other important factors that may cause future results to differ materially from those anticipated. These risks include, but are not limited to, the effects of general macroeconomic conditions, prevailing level of macroeconomic, business and operational uncertainty, including as a result of geopolitical events or other regional events or pandemics, changes to trade policies including tariffs and trade restrictions, as well as the current inflationary environment, and the effects of these conditions on the Company’s customers’ businesses and levels of business activity, including the effect of the current economic uncertainty and industry pressure on the spending decisions of the Company’s customers, Amdocs’ ability to grow in the business markets that it serves, Amdocs’ ability to successfully integrate acquired businesses, adverse effects of market competition, rapid technological shifts that may render the Company’s products and services obsolete, security incidents, including breaches and cyberattacks to our systems and networks and those of our partners or customers, potential loss of a major customer, our ability to develop long-term relationships with our customers, our ability to successfully and effectively implement artificial intelligence and Generative AI in the Company’s offerings and operations, and risks associated with operating businesses in the international market. Amdocs may elect to update these forward-looking statements at some point in the future; however, Amdocs specifically disclaims any obligation to do so. These and other risks are discussed at greater length in Amdocs’ filings with the Securities and Exchange Commission, including in our Annual Report on Form 20-F for the fiscal year ended September 30, 2025 filed on December 15, 2025, and for the first quarter of fiscal 2026 on February 17, 2026, for the second quarter of fiscal 2026 on May 26. 2026, and for the third quarter of fiscal 2026 on August 18. 2026. This presentation includes non-GAAP financial measures, including non-GAAP operating margin, free cash flow, revenue on a constant currency basis, non-GAAP net income, non-GAAP net income attributable to Amdocs Limited, and non-GAAP earnings per share. Free cash flow equals cash generated by operating activities less net capital expenditures. While in prior years Amdocs used normalized free cash flow, Amdocs is no longer reporting normalized free cash flow. Normalized free cash flow is not comparable to free cash flow. These non-GAAP financial measures are not in accordance with, or an alternative for, generally accepted accounting principles and may be different from non-GAAP financial measures used by other companies. In addition, these non-GAAP financial measures are not based on any comprehensive set of accounting rules or principles. Amdocs believes that non-GAAP financial measures have limitations in that they do not reflect all of the amounts associated with Amdocs’ results of operations as determined in accordance with GAAP and that these measures should only be used to evaluate Amdocs’ results of operations in conjunction with the corresponding GAAP measures. Please refer to the appendix for a reconciliation of these metrics to the most comparable GAAP provision. Amdocs believes that these measures provide useful information to investors and management regarding financial and business trends relating to its financial condition and results of operations, as well as the net amount of cash generated by its business operations after taking into account capital spending required to maintain or expand the business. This presentation also includes pro forma metrics which exclude the financial impact of OpenMarket (divested on December 31, 2020) from fiscal year 2021. Please also review the information contained in Amdocs’ press release dated November 3, 2026, with respect to earnings for fiscal Q4 2026. The press release contains additional information regarding Amdocs’ outlook for fiscal year 2027 and certain non-GAAP metrics and their reconciliations.

Today’s speakers Tal Rozenfeld Chief Financial Officer Shimie Hortig President & Chief Executive Officer
Agenda Strategy & Business Performance Update Shimie Hortig President & Chief Executive Officer Financial Review & Outlook Tal Rozenfeld Chief Financial Officer Q&A

President & Chief Executive Officer Shimie Hortig Strategy and Business Performance Update
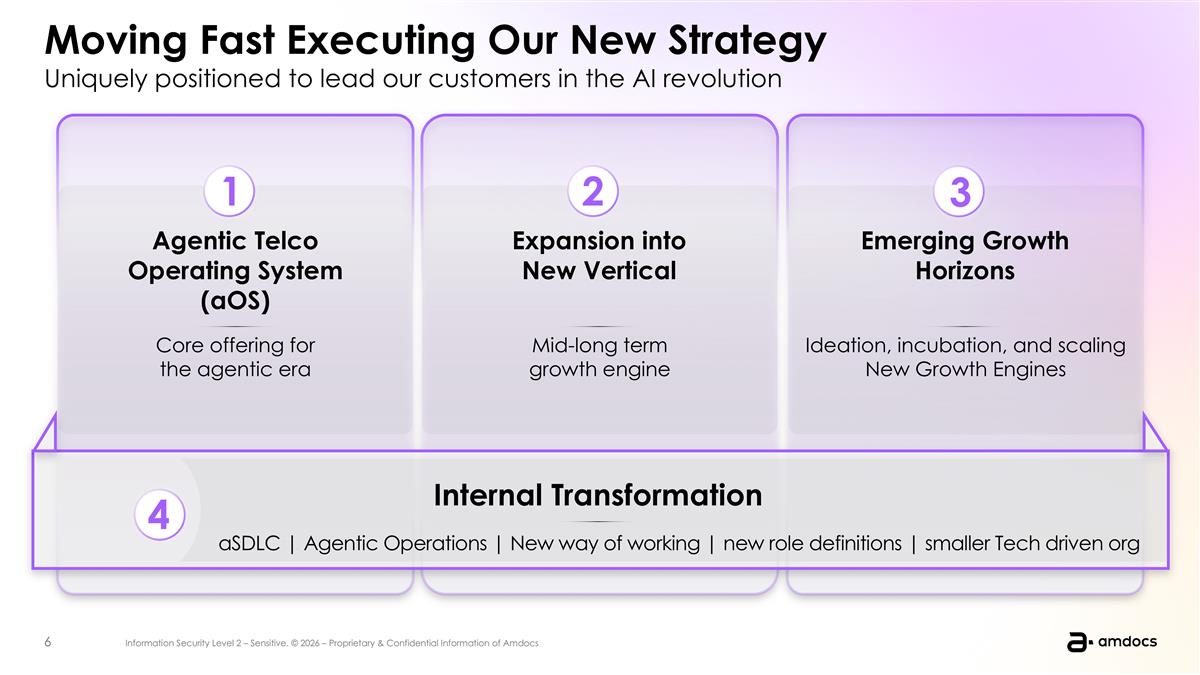
Moving Fast Executing Our New Strategy Uniquely positioned to lead our customers in the AI revolution Agentic Telco Operating System (aOS) Expansion into New Vertical Emerging Growth Horizons Core offering for the agentic era Mid-long term growth engine Ideation, incubation, and scaling New Growth Engines Internal Transformation aSDLC | Agentic Operations | New way of working | new role definitions | smaller Tech driven org 2 1 3 4 2 1 3 Agentic Telco Operating System (aOS) Expansion into New Vertical New Growth Horizons 4 Core offering for the agentic era Mid-long growth engine Ideation, incubation, and scaling New Growth Engines Internal Transformation aSDLC | Agentic Operations | New way of working | new role definitions | smaller Tech driven org
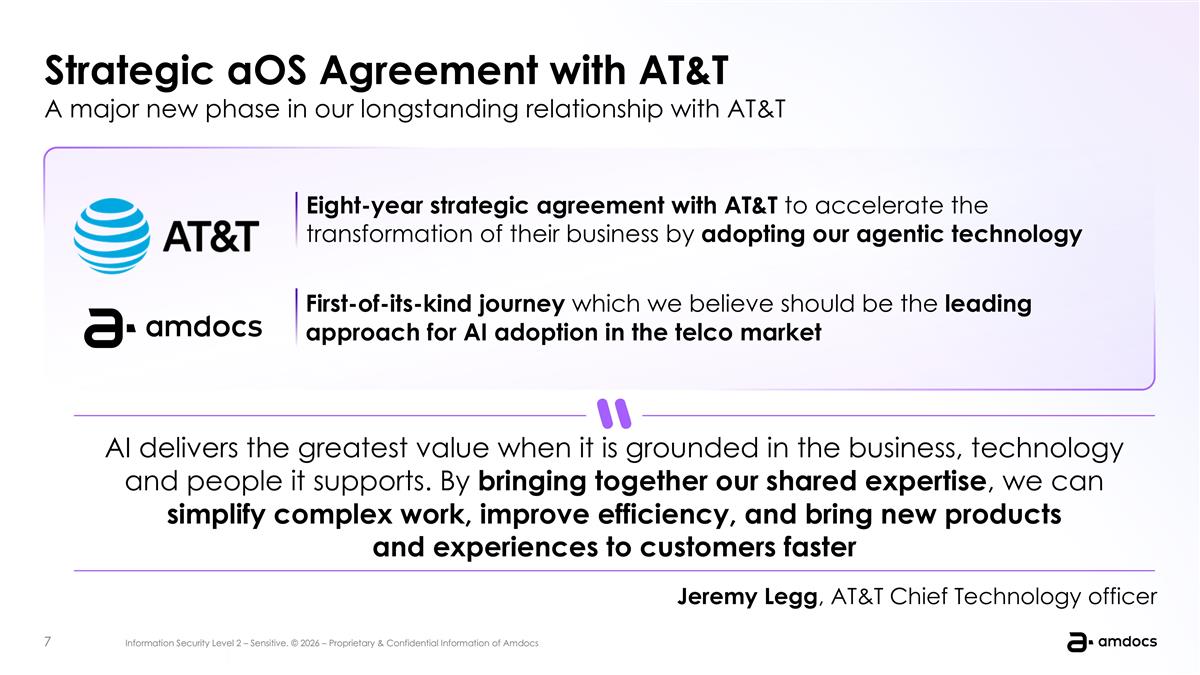
Strategic aOS Agreement with AT&T A major new phase in our longstanding relationship with AT&T 10-year strategic engagement to transform and manage its end-to-end IT ecosystem, leveraging Amdocs agentic telco operating system Expands Amdocs’ footprint in the CALA region and moves beyond traditional IT operations into an AI-driven operating model Demonstrates of our ability to handle highly complex mission critical operations across multiple markets Caribbean Costa Rica Panama Puerto Rico Miami Denver Business value “AI delivers the greatest value when it is grounded in the business, technology and people it supports. By bringing together our shared expertise, we can simplify complex work, improve efficiency, and bring new products and experiences to customers faster.” Eight-year strategic agreement with AT&T to accelerate the transformation of their business by adopting our agentic technology First-of-its-kind journey which we believe should be the leading approach for AI adoption in the telco market Jeremy Legg, AT&T Chief Technology officer AI delivers the greatest value when it is grounded in the business, technology and people it supports. By bringing together our shared expertise, we can simplify complex work, improve efficiency, and bring new products and experiences to customers faster Jeremy Legg, AT&T Chief Technology officer
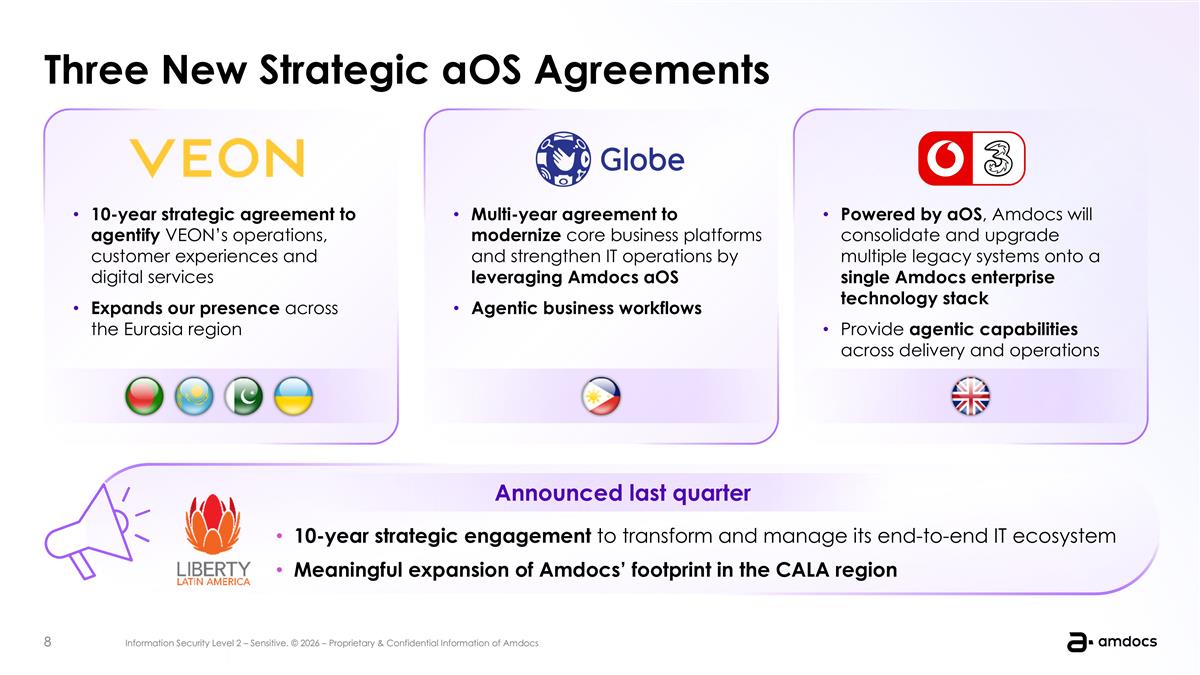
Three New Strategic aOS Agreements 10-year strategic engagement to transform and manage its end-to-end IT ecosystem, leveraging Amdocs agentic telco operating system Expands Amdocs’ footprint in the CALA region and moves beyond traditional IT operations into an AI-driven operating model Demonstrates of our ability to handle highly complex mission critical operations across multiple markets Caribbean Costa Rica Panama Puerto Rico Miami Denver Business value 10-year strategic agreement to agentify VEON’s operations, customer experiences and digital services Expands our presence across the Eurasia region 10-year strategic engagement to transform and manage its end-to-end IT ecosystem Meaningful expansion of Amdocs’ footprint in the CALA region Announced last quarter Multi-year agreement to modernize core business platforms and strengthen IT operations by leveraging Amdocs aOS Agentic business workflows Powered by aOS, Amdocs will consolidate and upgrade multiple legacy systems onto a single Amdocs enterprise technology stack Provide agentic capabilities across delivery and operations
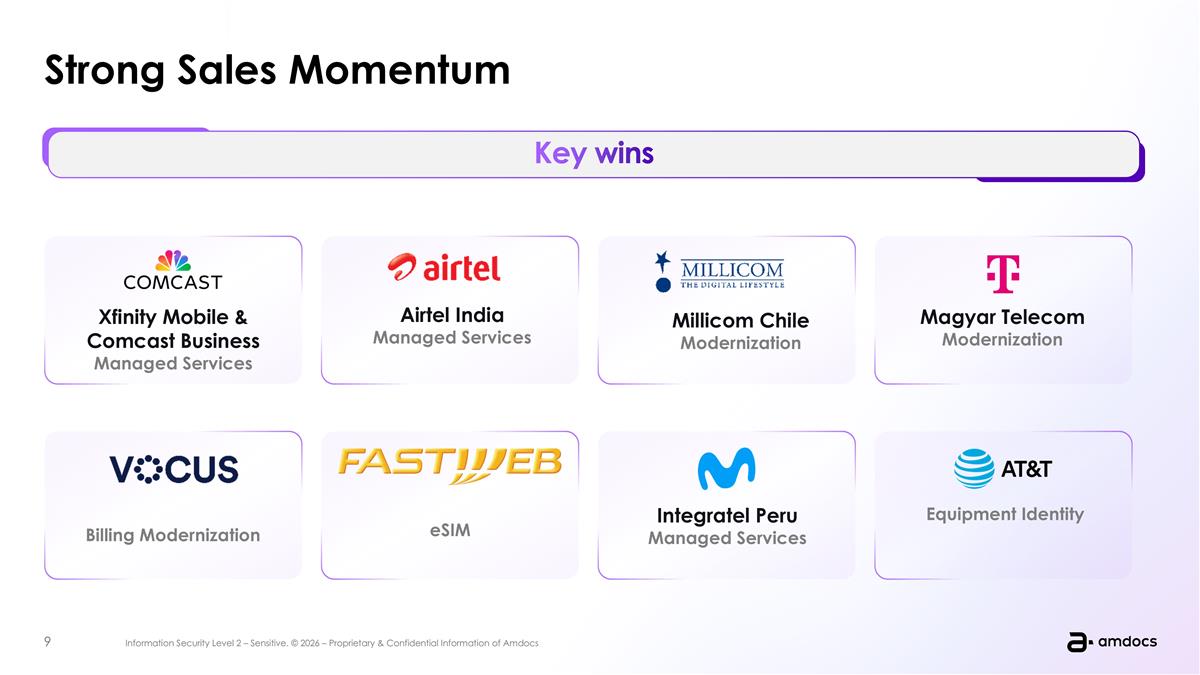
10-year strategic engagement to transform and manage its end-to-end IT ecosystem, leveraging Amdocs agentic telco operating system Expands Amdocs’ footprint in the CALA region and moves beyond traditional IT operations into an AI-driven operating model Demonstrates of our ability to handle highly complex mission critical operations across multiple markets Caribbean Costa Rica Panama Puerto Rico Miami Denver Strong Sales Momentum Key milestones Key wins Equipment Identity Integratel Peru Managed Services Magyar Telecom Modernization Xfinity Mobile & Comcast Business Managed Services Airtel India Managed Services eSIM Billing Modernization Millicom Chile Modernization
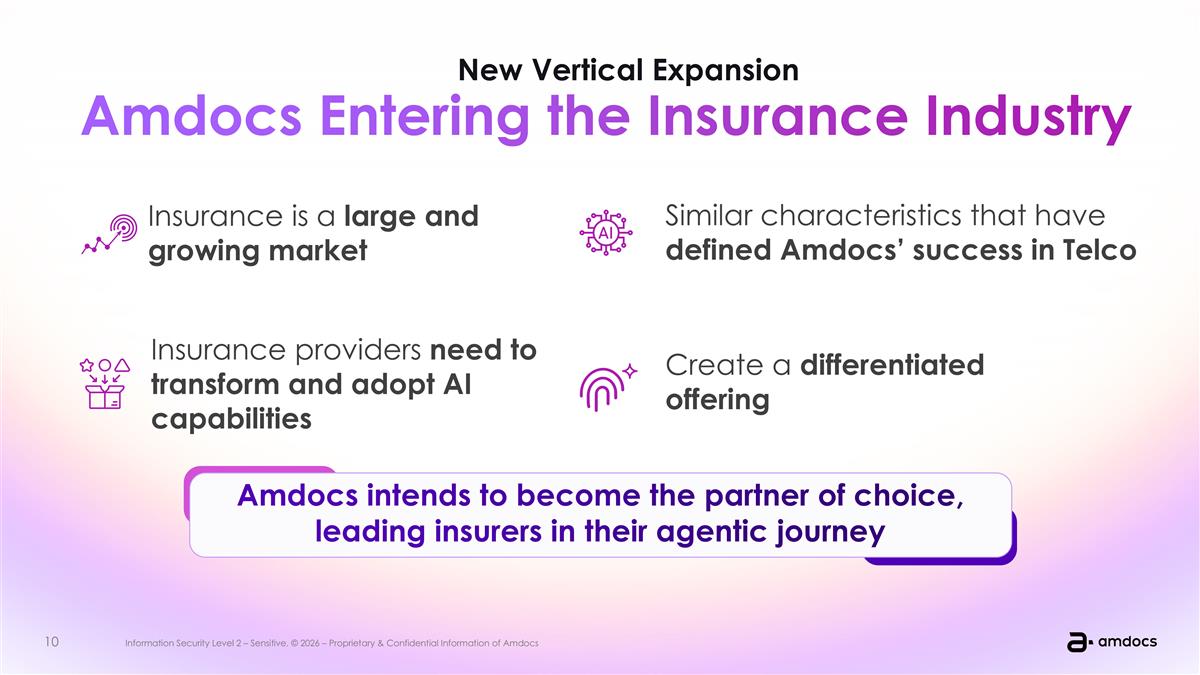
Entering FY28 with mid-single digit revenue growth and double-digit shareholder return Insurance industry shares the same characteristics that have defined Amdocs’ success in telecommunications Creating a differentiated offering for insurers Significantly expanding our addressable market Insurance providers need to transform and adopt AI capabilities across their core operations and business workflows. New Vertical Expansion Amdocs Entering the Insurance Industry Amdocs intends to become the partner of choice, leading insurers in their agentic journey Insurance is a large and growing market Insurance providers need to transform and adopt AI capabilities Create a differentiated offering Similar characteristics that have defined Amdocs’ success in Telco
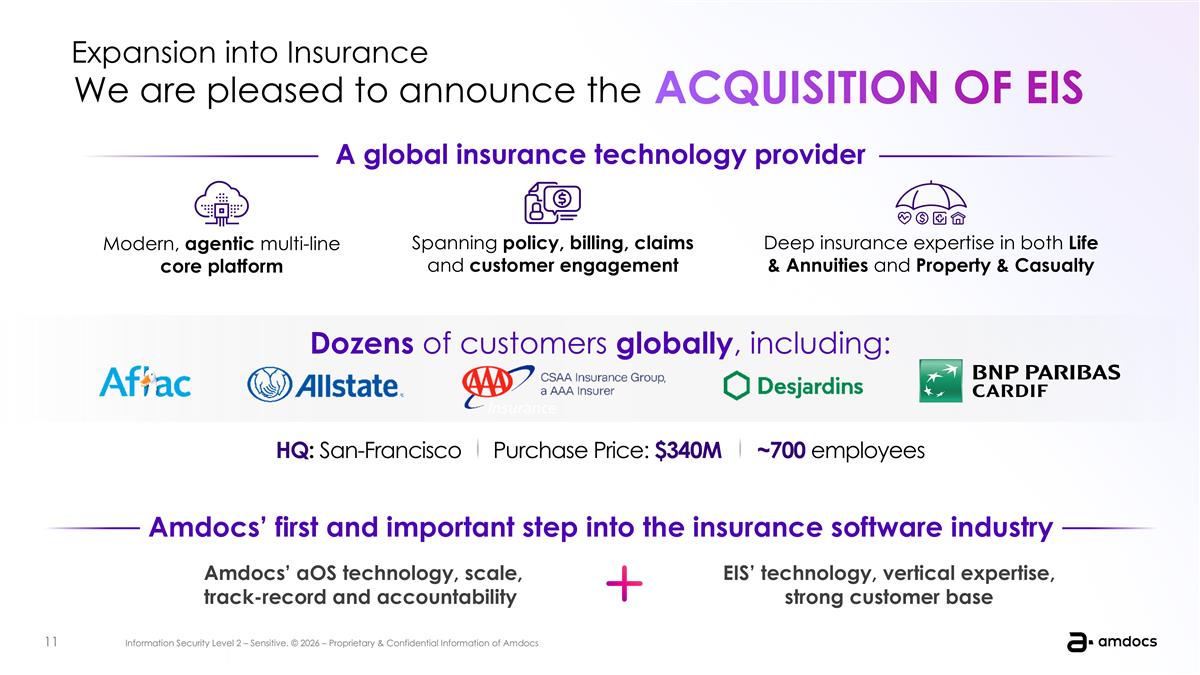
Dozens of customers globally, including: Entering FY28 with mid-single digit revenue growth and double-digit shareholder return Modern, agentic multi-line core platform Spanning policy, billing, claims and customer engagement Deep insurance expertise in both Life & Annuities and Property & Casualty Add small thing here ~700 employees Purchase Price: $xxxm HQ: San-Francisco ~700 employees Purchase Price: $340M HQ: San-Francisco A global insurance technology provider ACQUISITION OF EIS We are pleased to announce the Expansion into Insurance Amdocs’ first and important step into the insurance software industry Amdocs’ aOS technology, scale, engineering pedigree, transformation track-record and accountability mode EIS’ advanced technology, deep vertical expertise Amdocs’ first and important step into the insurance software industry A global insurance technology provider Amdocs’ aOS technology, scale, track-record and accountability EIS’ technology, vertical expertise, strong customer base ACQUISITION OF EIS
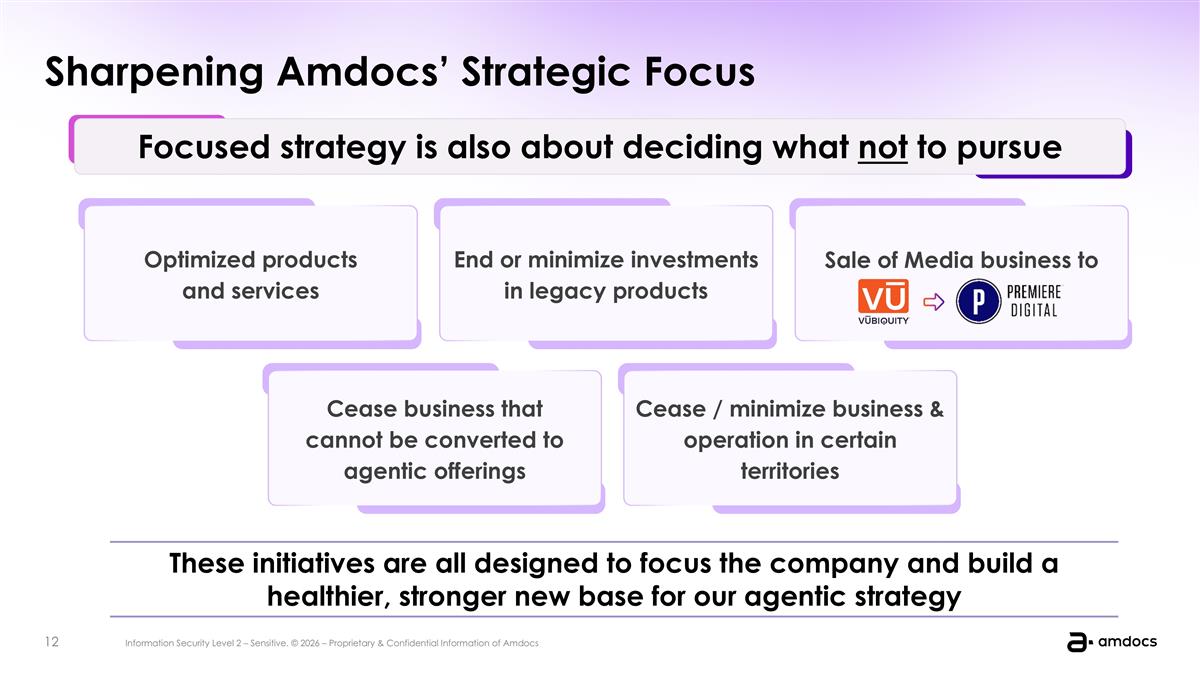
4 Sharpening Amdocs’ Strategic Focus Focused strategy is also about deciding what not to pursue These initiatives are all designed to focus the company and build a healthier, stronger new base for our agentic strategy Optimized products and services End or minimize investments in legacy products Sale of Media business to Cease business that cannot be converted to agentic offerings Cease / minimize business & operation in certain territories
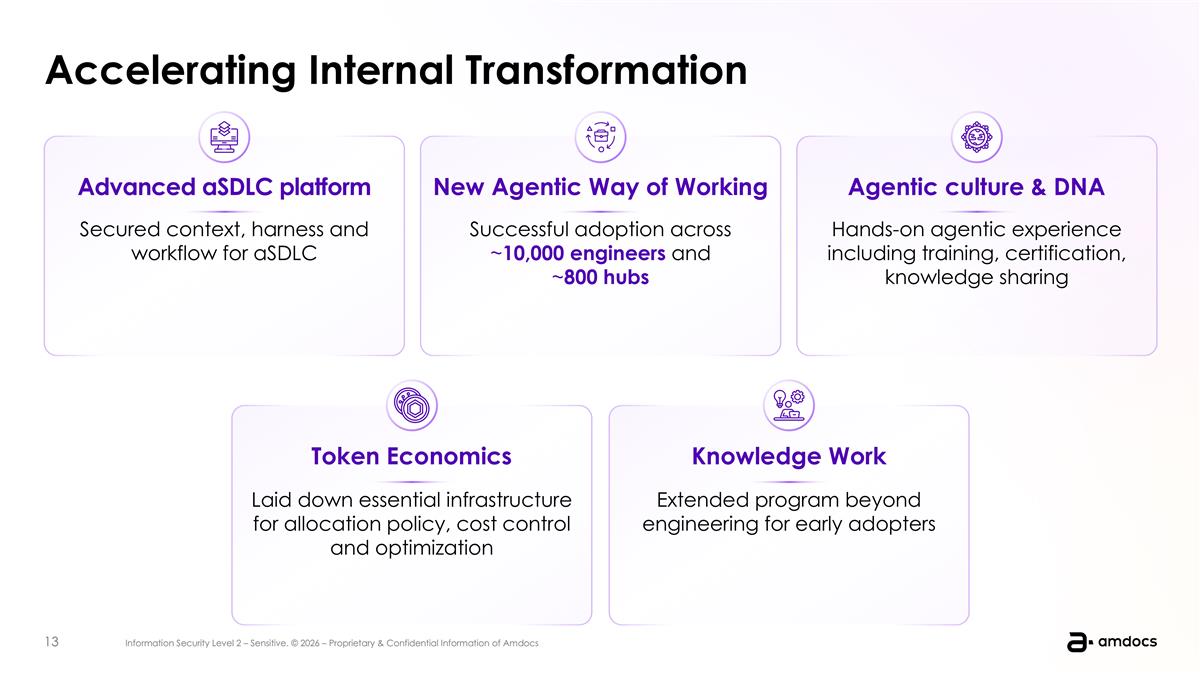
Successful adoption across ~10,000 engineers and ~800 hubs Secured context, harness and workflow for aSDLC Hands-on agentic experience including training, certification, knowledge sharing 10C Upgrade + Cognitive Core + MGS Extension – Rolled-over to Q4 Managed GenAI Transformation - delays in signing DA aOS / eSIM / Digital and extension AI Managed Services – Rolled-over to Q4 MGS Openet MGS + Mobile Billing Transformation MGS Renewal MGS Renewal UK Tracker - Internal Transformation Accelerating Internal Transformation Advanced aSDLC platform New Agentic Way of Working Agentic culture & DNA Token Economics Laid down essential infrastructure for allocation policy, cost control and optimization Knowledge Work Extended program beyond engineering for early adopters Inception of aSDLC platform WoW rollout: successful adoption across 10,000 workers and 800 hubs Agentic culture & DNA: hands on agentic experience including training, certification, conferences, meetups Tokenomics: laid down essential infrastructure for allocation policy, cost control and optimization Knowledge Work: extended program beyond engineering for early adopters (everyone is a builder)
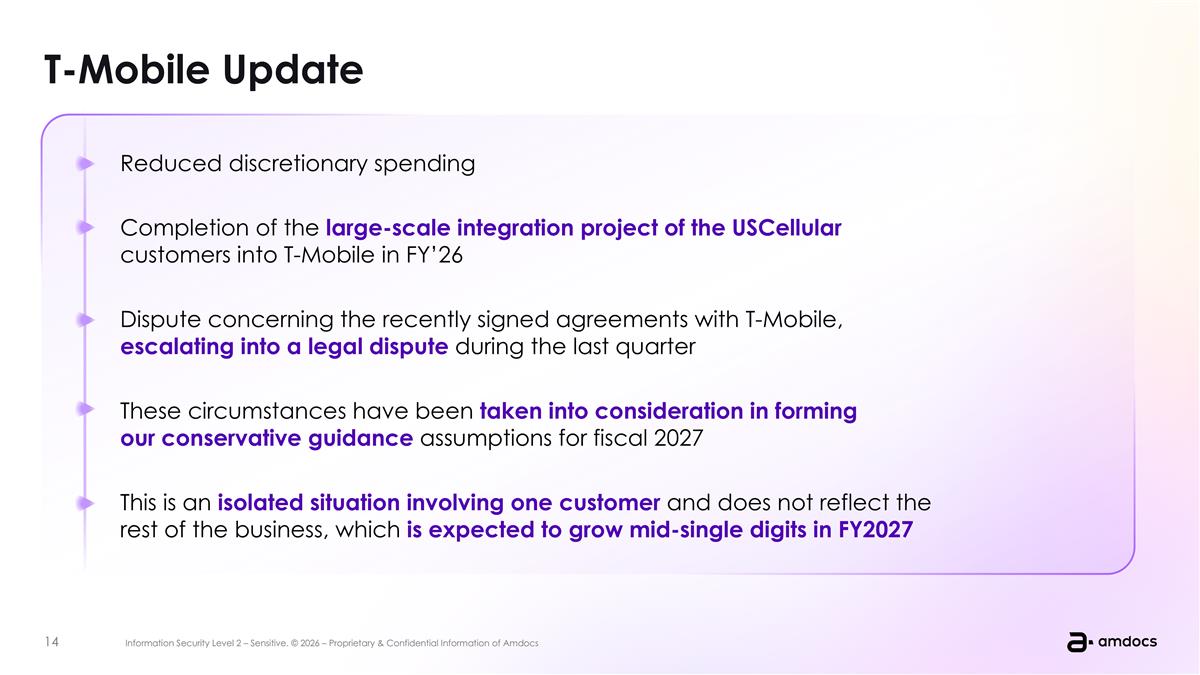
T-Mobile Update Entering FY28 with mid-single digit revenue growth and double-digit shareholder return Reduced discretionary spending Completion of the large-scale integration project of the UScellular customers into T-Mobile in FY’26 Dispute concerning the recently signed agreements with T-Mobile, escalating into a legal dispute during the last quarter These circumstances have been taken into consideration in forming our conservative guidance assumptions for fiscal 2027 This is a unique situation involving one customer and does not reflect the rest of the business, which continues showing growth Reduced discretionary spending Completion of the large-scale integration project of the USCellular customers into T-Mobile in FY’26 Dispute concerning the recently signed agreements with T-Mobile, escalating into a legal dispute during the last quarter These circumstances have been taken into consideration in forming our conservative guidance assumptions for fiscal 2027 This is an isolated situation involving one customer and does not reflect the rest of the business, which is expected to grow mid-single digits in FY2027
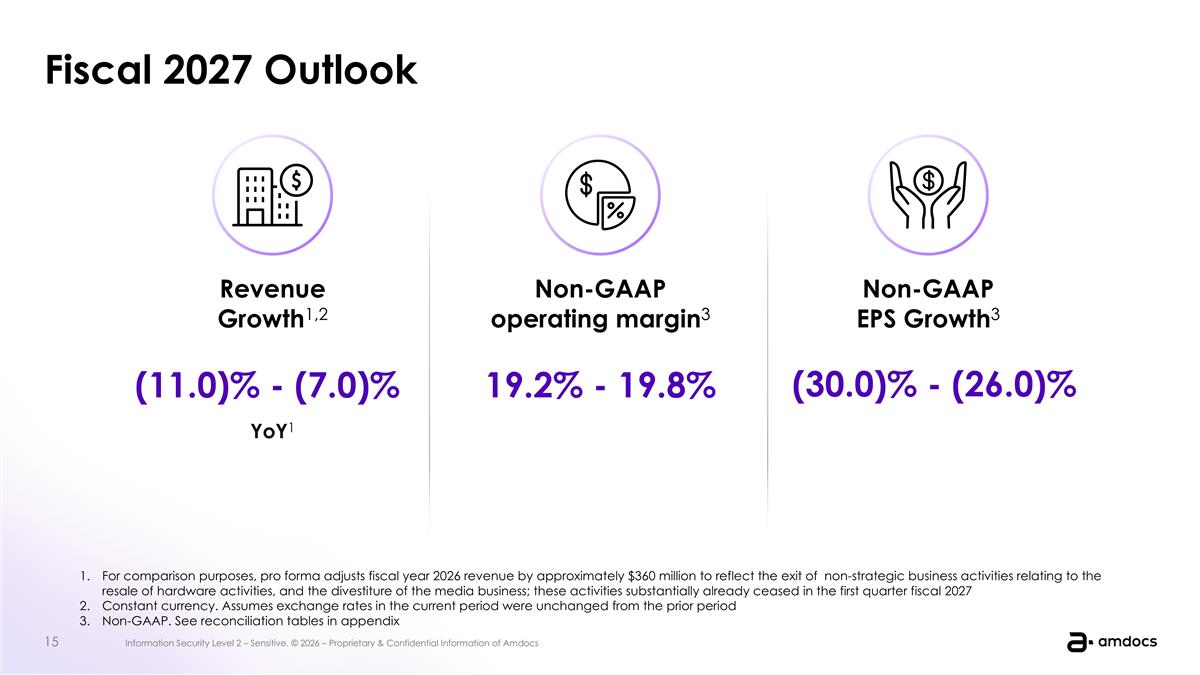
2 PART Fiscal 2027 Outlook Non-GAAP EPS Growth3 (30.0)% - (26.0)% Non-GAAP operating margin3 19.2% - 19.8% Revenue Growth1,2 (11.0)% - (7.0)% YoY1 For comparison purposes, pro forma adjusts fiscal year 2026 revenue by approximately $360 million to reflect the exit of non-strategic business activities relating to the resale of hardware activities, and the divestiture of the media business; these activities substantially already ceased in the first quarter fiscal 2027 Constant currency. Assumes exchange rates in the current period were unchanged from the prior period Non-GAAP. See reconciliation tables in appendix
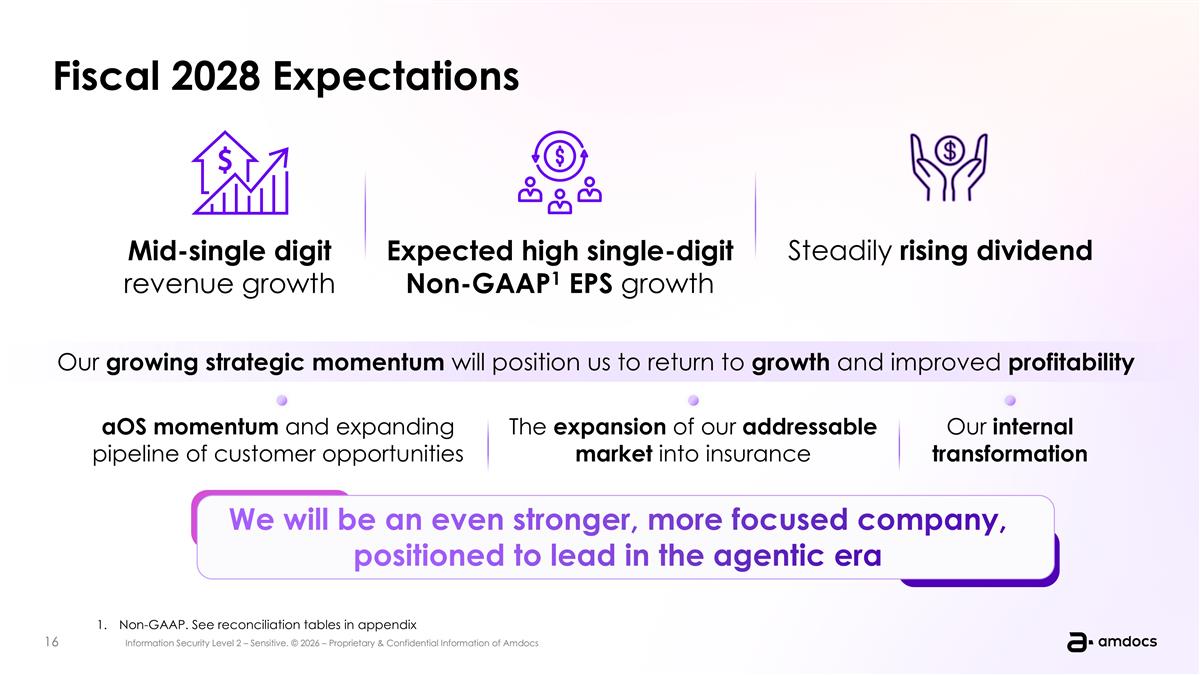
Fiscal 2028 Expectations Mid-single digit revenue growth Expected high single-digit Non-GAAP1 EPS growth Our growing strategic momentum will position us to return to growth and improved profitability aOS momentum and expanding pipeline of customer opportunities The expansion of our addressable market into insurance Our internal transformation We will be an even stronger, more focused company, positioned to lead in the agentic era aOS momentum and traction of our strategy The expansion of addressable market into insurance Our internal transformation Non-GAAP. See reconciliation tables in appendix Steadily rising dividend
Chief Financial Officer Tal Rozenfeld Financial Review & Outlook
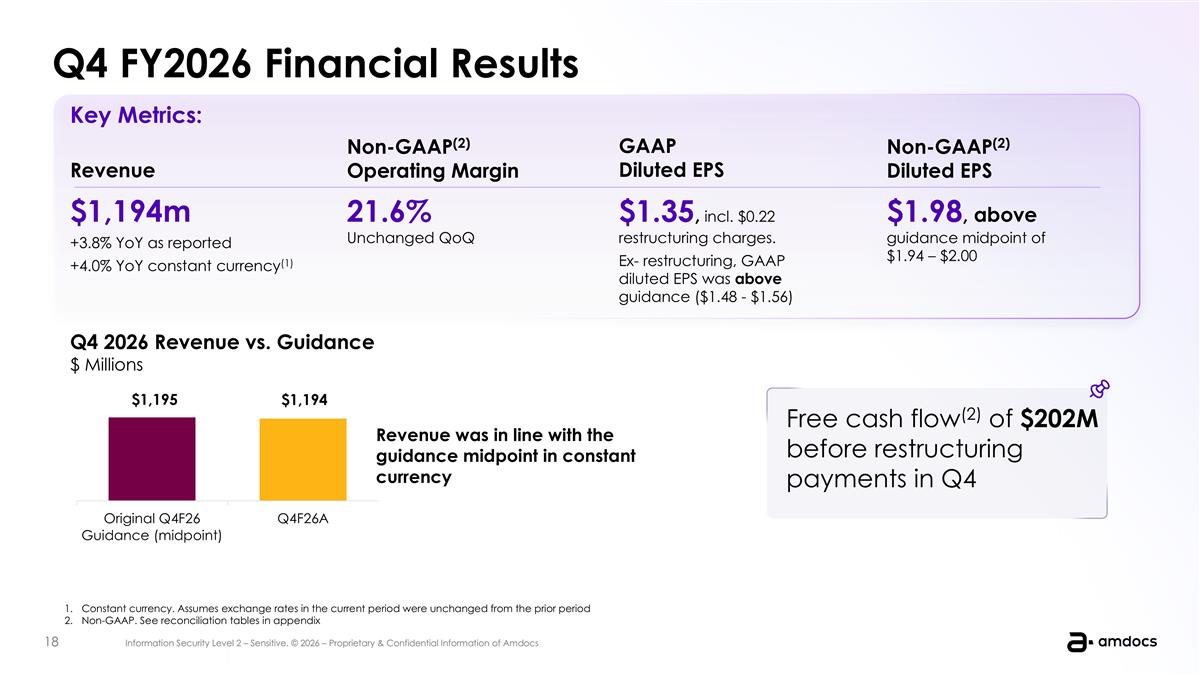
Constant currency. Assumes exchange rates in the current period were unchanged from the prior period Non-GAAP. See reconciliation tables in appendix Revenue $1,194m +3.8% YoY as reported +4.0% YoY constant currency(1) Non-GAAP(2) Operating Margin $1.98, above guidance midpoint of $1.94 – $2.00 GAAP Diluted EPS $1.35, incl. $0.22 restructuring charges. Ex- restructuring, GAAP diluted EPS was above guidance ($1.48 - $1.56) Non-GAAP(2) Diluted EPS 21.6% Unchanged QoQ Key Metrics: Q4 2026 Revenue vs. Guidance $ Millions Revenue was in line with the guidance midpoint in constant currency Free cash flow(2) of $202M before restructuring payments in Q4 Q4 FY2026 Financial Results
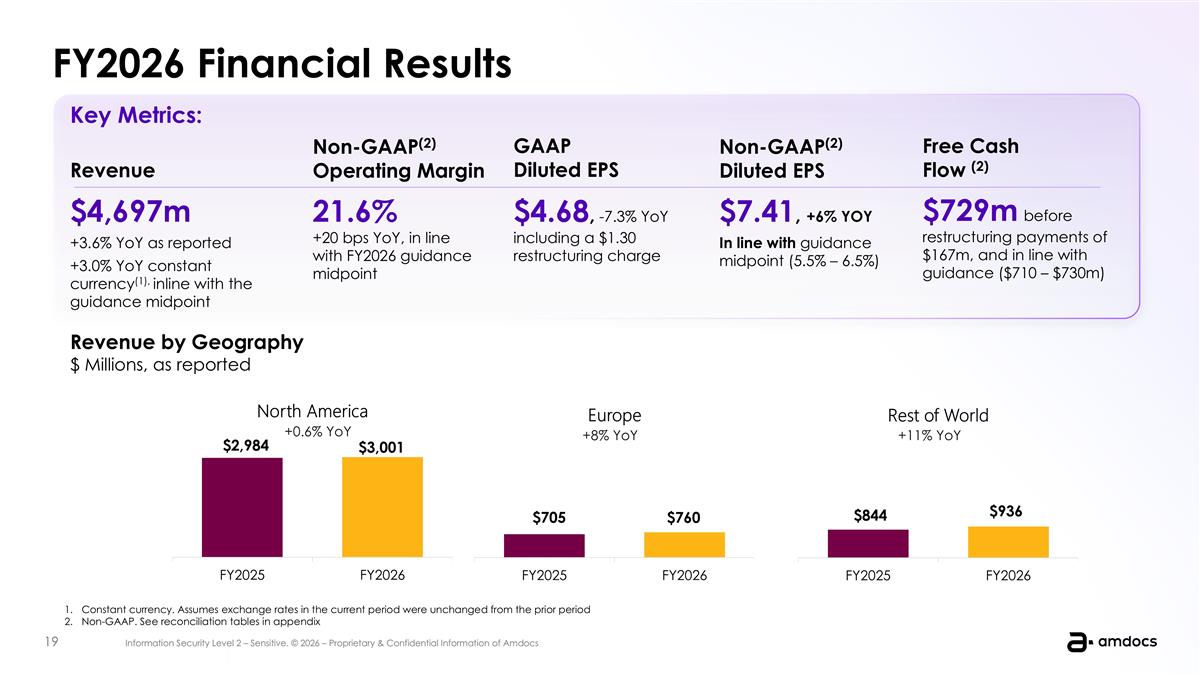
FY2026 Financial Results Constant currency. Assumes exchange rates in the current period were unchanged from the prior period Non-GAAP. See reconciliation tables in appendix Revenue $4,697m +3.6% YoY as reported +3.0% YoY constant currency(1), inline with the guidance midpoint Non-GAAP(2) Operating Margin $7.41, +6% YOY In line with guidance midpoint (5.5% – 6.5%) GAAP Diluted EPS $4.68, -7.3% YoY including a $1.30 restructuring charge Non-GAAP(2) Diluted EPS 21.6% +20 bps YoY, in line with FY2026 guidance midpoint Key Metrics: Revenue by Geography $ Millions, as reported $729m before restructuring payments of $167m, and in line with guidance ($710 – $730m) Free Cash Flow (2) +0.6% YoY +8% YoY +11% YoY
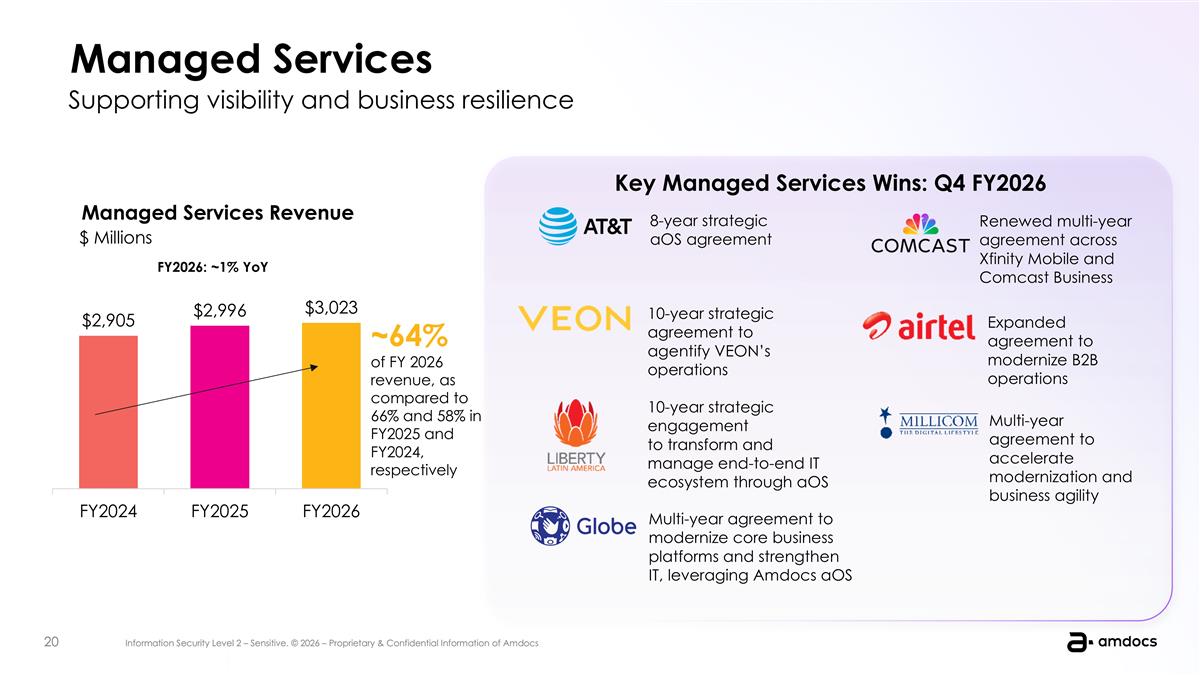
Managed Services Supporting visibility and business resilience ~64% of FY 2026 revenue, as compared to 66% and 58% in FY2025 and FY2024, respectively Managed Services Revenue 8-year strategic aOS agreement 10-year strategic agreement to agentify VEON’s operations Key Managed Services Wins: Q4 FY2026 FY2026: ~1% YoY 10-year strategic engagement to transform and manage end-to-end IT ecosystem through aOS Multi-year agreement to modernize core business platforms and strengthen IT, leveraging Amdocs aOS Renewed multi-year agreement across Xfinity Mobile and Comcast Business Expanded agreement to modernize B2B operations Multi-year agreement to accelerate modernization and business agility $ Millions
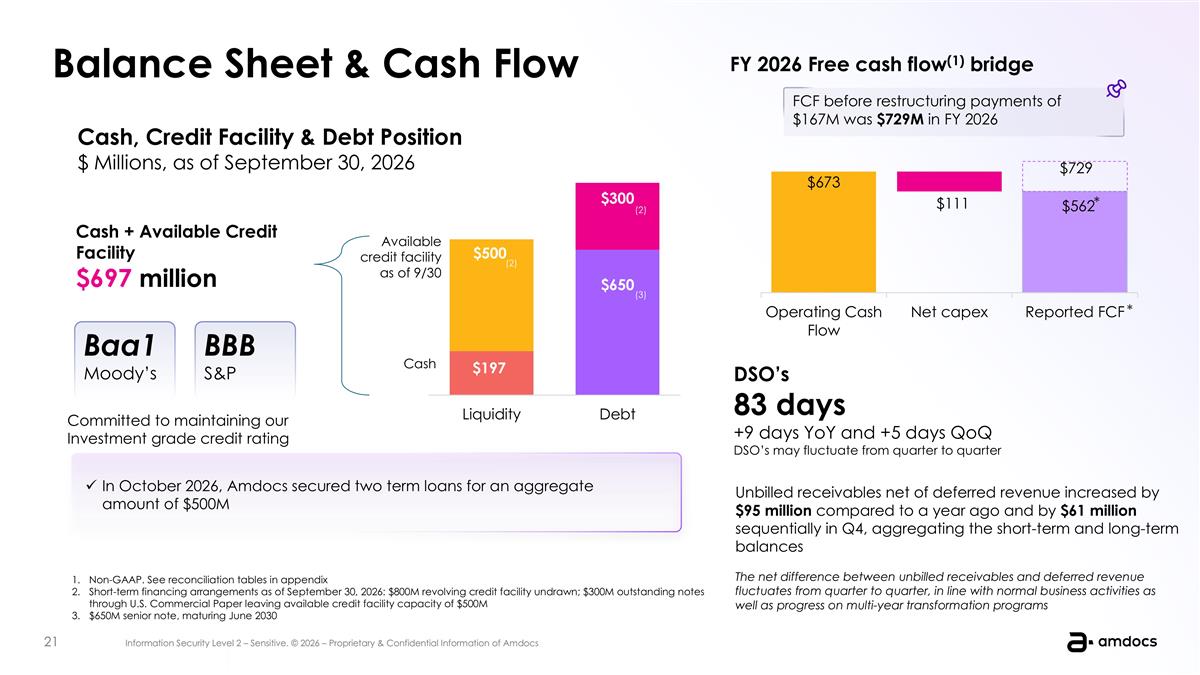
Balance Sheet & Cash Flow Cash, Credit Facility & Debt Position $ Millions, as of September 30, 2026 Cash + Available Credit Facility $697 million Committed to maintaining our Investment grade credit rating Baa1 Moody’s BBB S&P Available credit facility as of 9/30 Cash (3) DSO’s 83 days +9 days YoY and +5 days QoQ DSO’s may fluctuate from quarter to quarter Unbilled receivables net of deferred revenue increased by $95 million compared to a year ago and by $61 million sequentially in Q4, aggregating the short-term and long-term balances The net difference between unbilled receivables and deferred revenue fluctuates from quarter to quarter, in line with normal business activities as well as progress on multi-year transformation programs FY 2026 Free cash flow(1) bridge FCF before restructuring payments of $167M was $729M in FY 2026 (2) Non-GAAP. See reconciliation tables in appendix Short-term financing arrangements as of September 30, 2026: $800M revolving credit facility undrawn; $300M outstanding notes through U.S. Commercial Paper leaving available credit facility capacity of $500M $650M senior note, maturing June 2030 * * (2) In October 2026, Amdocs secured two term loans for an aggregate amount of $500M
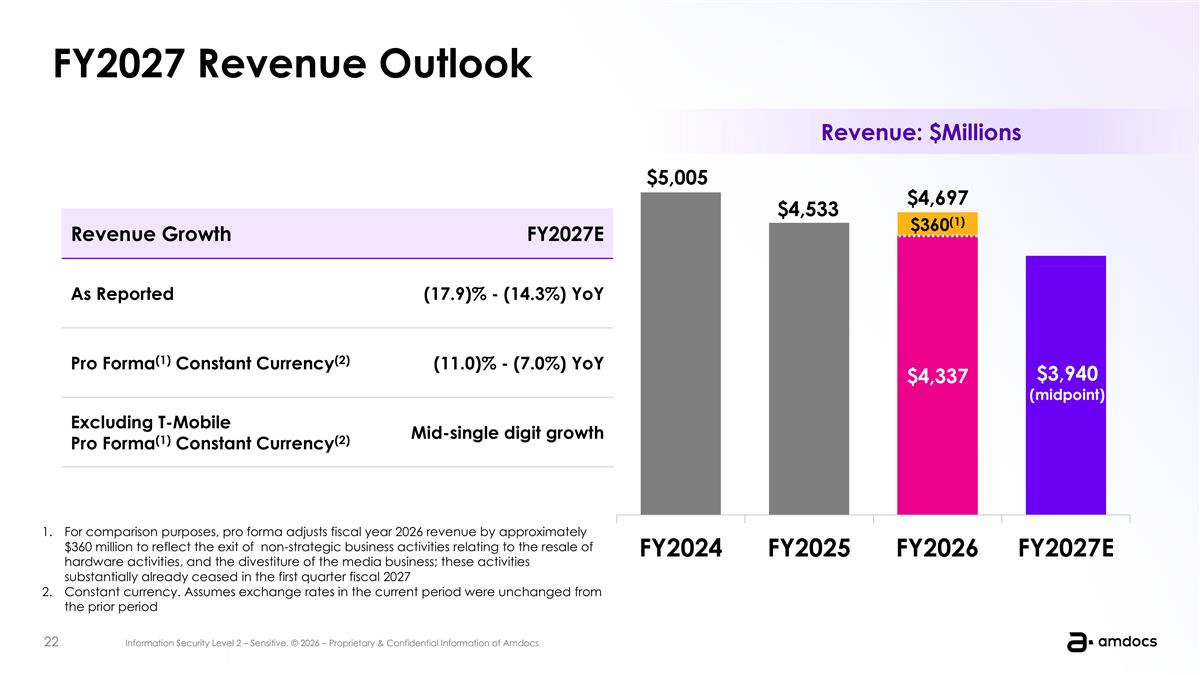
FY2027 Revenue Outlook For comparison purposes, pro forma adjusts fiscal year 2026 revenue by approximately $360 million to reflect the exit of non-strategic business activities relating to the resale of hardware activities, and the divestiture of the media business; these activities substantially already ceased in the first quarter fiscal 2027 Constant currency. Assumes exchange rates in the current period were unchanged from the prior period $4,697 Revenue Growth FY2027E As Reported (17.9)% - (14.3%) YoY Pro Forma(1) Constant Currency(2) (11.0)% - (7.0%) YoY Excluding T-Mobile Pro Forma(1) Constant Currency(2) Mid-single digit growth Revenue: $Millions
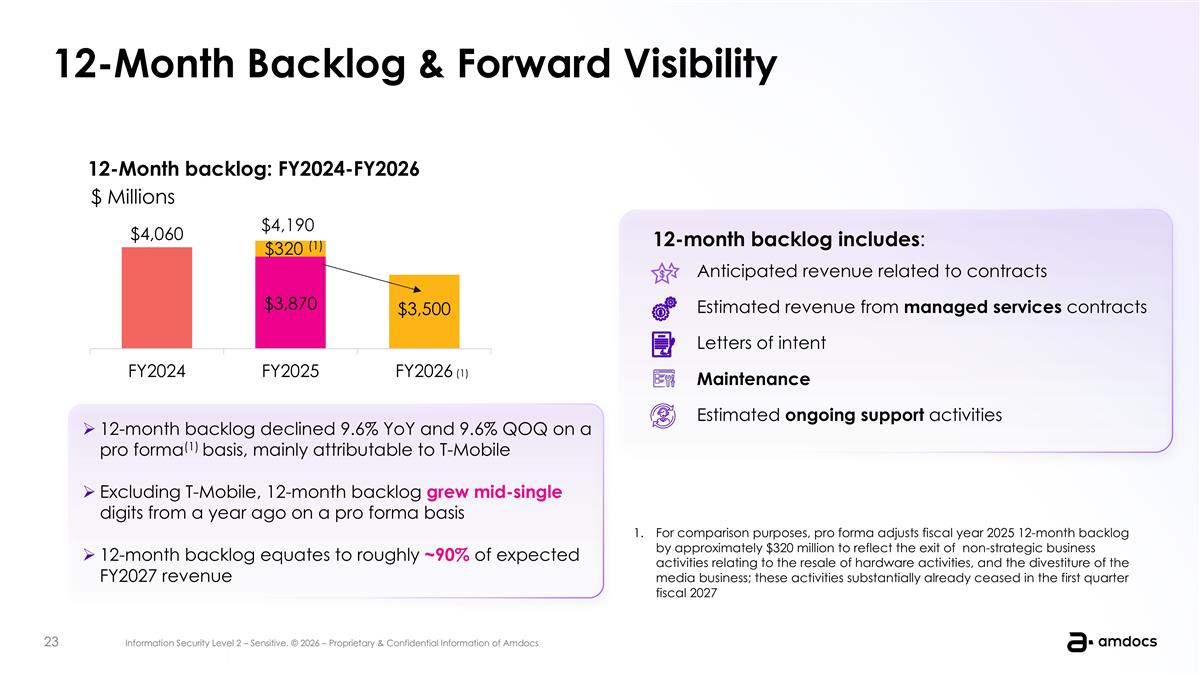
Telco headwinds are materializing: Flat ARPU, minimal growth, intense competition Agentic Delivery Agentic Governance Agentic Operations Agentic Core BSS/OSS Agentic Orchestraion Our goal Become the primary partner of choice to our customers in their Agentic journey Create a tailored path for every customer from any starting point This quarter we announced the sale of Vubiquity to Premiere Digital, a leading media services and technology solutions company Why we made this decision 1. As the media industry continues to evolve, we believe Vubiquity will be best positioned to grow in an organization where media services and content operations are at the center of the business and its investment priorities 2. At the same time, we are increasingly focused on the priorities at the heart of Amdocs’ strategy Tracker - Internal Transformation 12-Month Backlog & Forward Visibility 12-Month backlog: FY2024-FY2026 12-month backlog includes: Anticipated revenue related to contracts Estimated revenue from managed services contracts Letters of intent Maintenance Estimated ongoing support activities 12-month backlog declined 9.6% YoY and 9.6% QOQ on a pro forma(1) basis, mainly attributable to T-Mobile Excluding T-Mobile, 12-month backlog grew mid-single digits from a year ago on a pro forma basis 12-month backlog equates to roughly ~90% of expected FY2027 revenue For comparison purposes, pro forma adjusts fiscal year 2025 12-month backlog by approximately $320 million to reflect the exit of non-strategic business activities relating to the resale of hardware activities, and the divestiture of the media business; these activities substantially already ceased in the first quarter fiscal 2027 $ Millions (1)
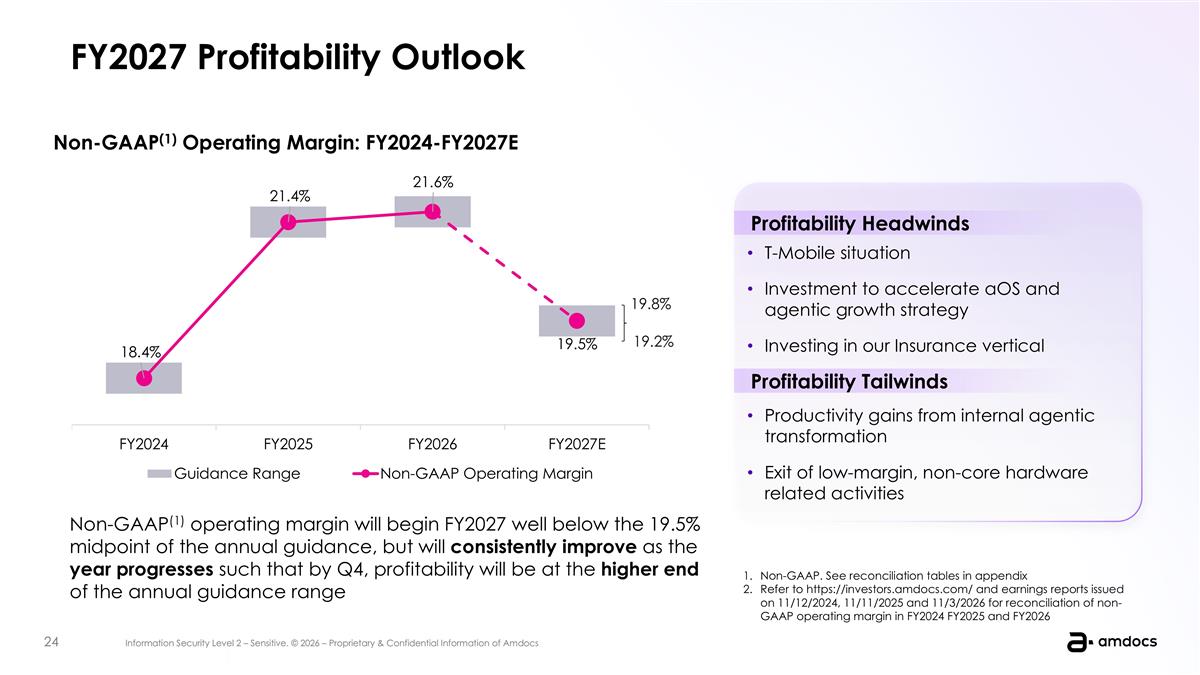
FY2027 Profitability Outlook Non-GAAP(1) operating margin will begin FY2027 well below the 19.5% midpoint of the annual guidance, but will consistently improve as the year progresses such that by Q4, profitability will be at the higher end of the annual guidance range Non-GAAP. See reconciliation tables in appendix Refer to https://investors.amdocs.com/ and earnings reports issued on 11/12/2024, 11/11/2025 and 11/3/2026 for reconciliation of non-GAAP operating margin in FY2024 FY2025 and FY2026 Non-GAAP(1) Operating Margin: FY2024-FY2027E 19.8% 19.2% Productivity gains from internal agentic transformation Exit of low-margin, non-core hardware related activities Profitability Headwinds T-Mobile situation Investment to accelerate aOS and agentic growth strategy Investing in our Insurance vertical Profitability Tailwinds
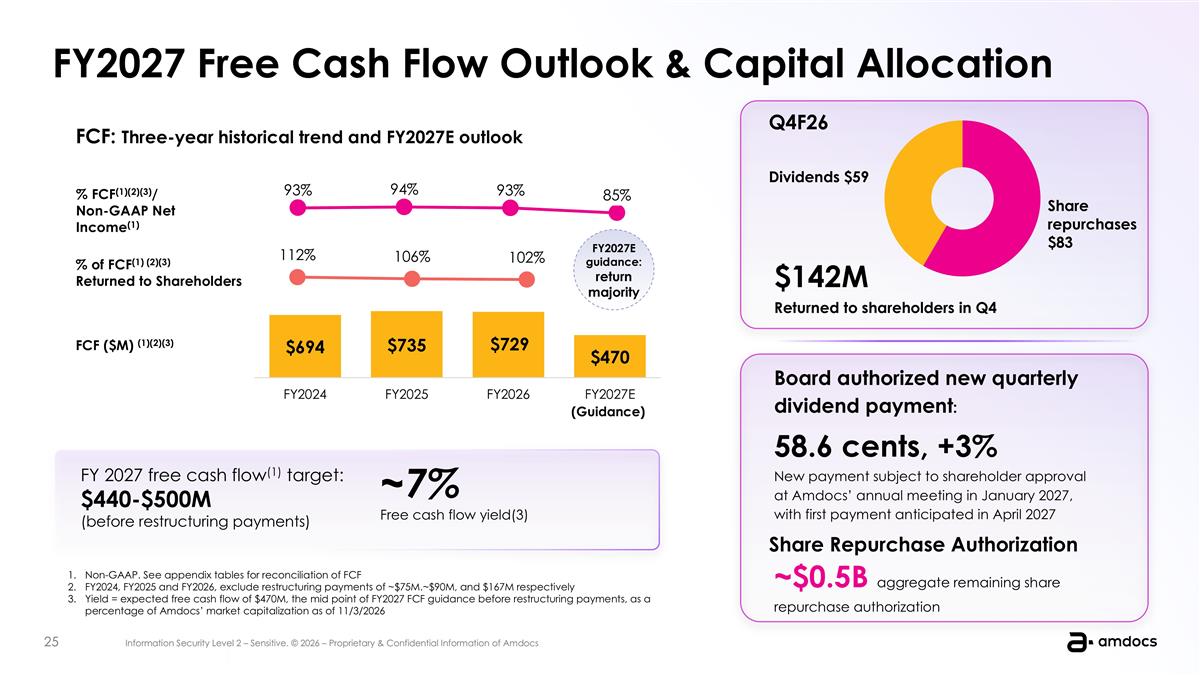
Telco headwinds are materializing: Flat ARPU, minimal growth, intense competition Agentic Delivery Agentic Governance Agentic Operations Agentic Core BSS/OSS Agentic Orchestraion Our goal Become the primary partner of choice to our customers in their Agentic journey Create a tailored path for every customer from any starting point This quarter we announced the sale of Vubiquity to Premiere Digital, a leading media services and technology solutions company Why we made this decision 1. As the media industry continues to evolve, we believe Vubiquity will be best positioned to grow in an organization where media services and content operations are at the center of the business and its investment priorities 2. At the same time, we are increasingly focused on the priorities at the heart of Amdocs’ strategy Tracker - Internal Transformation FY2027 Free Cash Flow Outlook & Capital Allocation % FCF(1)(2)(3)/ Non-GAAP Net Income(1) FCF ($M) (1)(2)(3) % of FCF(1) (2)(3) Returned to Shareholders FCF: Three-year historical trend and FY2027E outlook (Guidance) $142M Returned to shareholders in Q4 ~$0.5B aggregate remaining share repurchase authorization Board authorized new quarterly dividend payment: 58.6 cents, +3% New payment subject to shareholder approval at Amdocs’ annual meeting in January 2027, with first payment anticipated in April 2027 Share Repurchase Authorization FY 2027 free cash flow(1) target: $440-$500M (before restructuring payments) ~7% Free cash flow yield(3) Non-GAAP. See appendix tables for reconciliation of FCF FY2024, FY2025 and FY2026, exclude restructuring payments of ~$75M.~$90M, and $167M respectively Yield = expected free cash flow of $470M, the mid point of FY2027 FCF guidance before restructuring payments, as a percentage of Amdocs’ market capitalization as of 11/3/2026 FY2027E guidance: return majority Q4F26
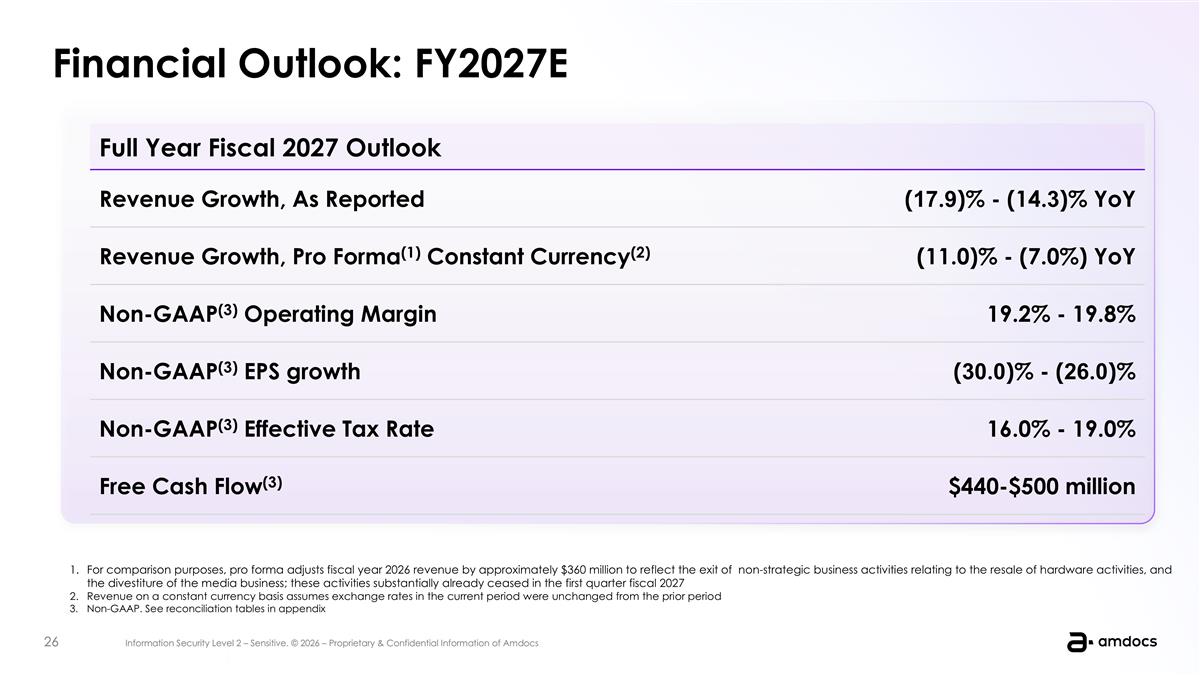
Telco headwinds are materializing: Flat ARPU, minimal growth, intense competition Agentic Delivery Agentic Governance Agentic Operations Agentic Core BSS/OSS Agentic Orchestraion Our goal Become the primary partner of choice to our customers in their Agentic journey Create a tailored path for every customer from any starting point This quarter we announced the sale of Vubiquity to Premiere Digital, a leading media services and technology solutions company Why we made this decision 1. As the media industry continues to evolve, we believe Vubiquity will be best positioned to grow in an organization where media services and content operations are at the center of the business and its investment priorities 2. At the same time, we are increasingly focused on the priorities at the heart of Amdocs’ strategy Tracker - Internal Transformation Financial Outlook: FY2027E Full Year Fiscal 2027 Outlook Revenue Growth, As Reported (17.9)% - (14.3)% YoY Revenue Growth, Pro Forma(1) Constant Currency(2) (11.0)% - (7.0%) YoY Non-GAAP(3) Operating Margin 19.2% - 19.8% Non-GAAP(3) EPS growth (30.0)% - (26.0)% Non-GAAP(3) Effective Tax Rate 16.0% - 19.0% Free Cash Flow(3) $440-$500 million For comparison purposes, pro forma adjusts fiscal year 2026 revenue by approximately $360 million to reflect the exit of non-strategic business activities relating to the resale of hardware activities, and the divestiture of the media business; these activities substantially already ceased in the first quarter fiscal 2027 Revenue on a constant currency basis assumes exchange rates in the current period were unchanged from the prior period Non-GAAP. See reconciliation tables in appendix
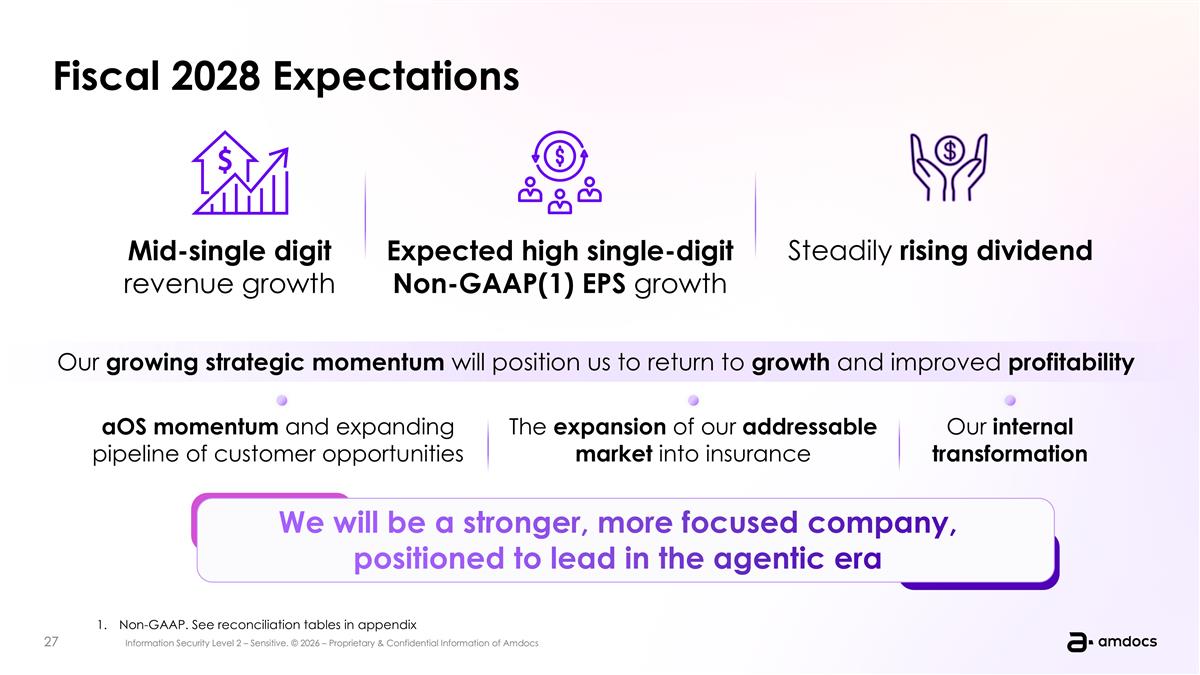
Fiscal 2028 Expectations Our growing strategic momentum will position us to return to growth and improved profitability aOS momentum and expanding pipeline of customer opportunities The expansion of our addressable market into insurance Our internal transformation We will be a stronger, more focused company, positioned to lead in the agentic era aOS momentum and traction of our strategy The expansion of addressable market into insurance Our internal transformation Non-GAAP. See reconciliation tables in appendix Mid-single digit revenue growth Expected high single-digit Non-GAAP(1) EPS growth Steadily rising dividend

Q&A
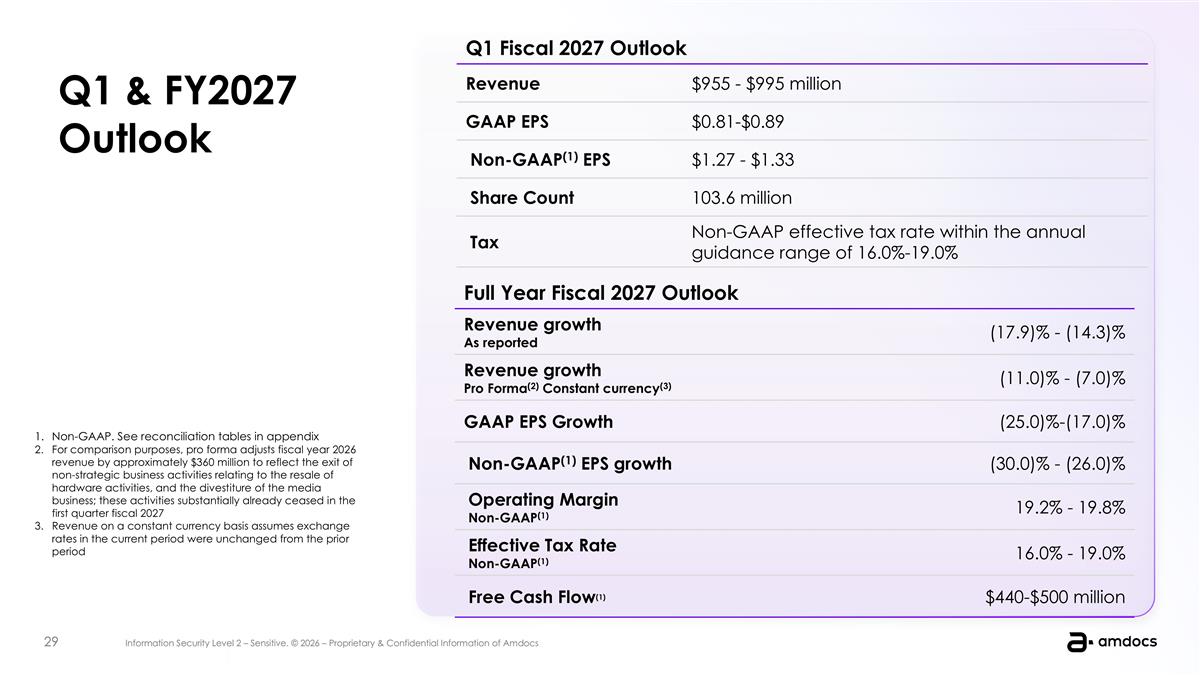
Telco headwinds are materializing: Flat ARPU, minimal growth, intense competition Agentic Delivery Agentic Governance Agentic Operations Agentic Core BSS/OSS Agentic Orchestraion Our goal Become the primary partner of choice to our customers in their Agentic journey Create a tailored path for every customer from any starting point This quarter we announced the sale of Vubiquity to Premiere Digital, a leading media services and technology solutions company Why we made this decision 1. As the media industry continues to evolve, we believe Vubiquity will be best positioned to grow in an organization where media services and content operations are at the center of the business and its investment priorities 2. At the same time, we are increasingly focused on the priorities at the heart of Amdocs’ strategy Tracker - Internal Transformation Non-GAAP. See reconciliation tables in appendix For comparison purposes, pro forma adjusts fiscal year 2026 revenue by approximately $360 million to reflect the exit of non-strategic business activities relating to the resale of hardware activities, and the divestiture of the media business; these activities substantially already ceased in the first quarter fiscal 2027 Revenue on a constant currency basis assumes exchange rates in the current period were unchanged from the prior period Q1 Fiscal 2027 Outlook Revenue $955 - $995 million GAAP EPS $0.81-$0.89 Non-GAAP(1) EPS $1.27 - $1.33 Share Count 103.6 million Tax Non-GAAP effective tax rate within the annual guidance range of 16.0%-19.0% Full Year Fiscal 2027 Outlook Revenue growth As reported (17.9)% - (14.3)% Revenue growth Pro Forma(2) Constant currency(3) (11.0)% - (7.0)% GAAP EPS Growth (25.0)%-(17.0)% Non-GAAP(1) EPS growth (30.0)% - (26.0)% Operating Margin Non-GAAP(1) 19.2% - 19.8% Effective Tax Rate Non-GAAP(1) 16.0% - 19.0% Free Cash Flow(1) $440-$500 million Q1 & FY2027 Outlook

Appendix Outlook & Reconciliation Tables
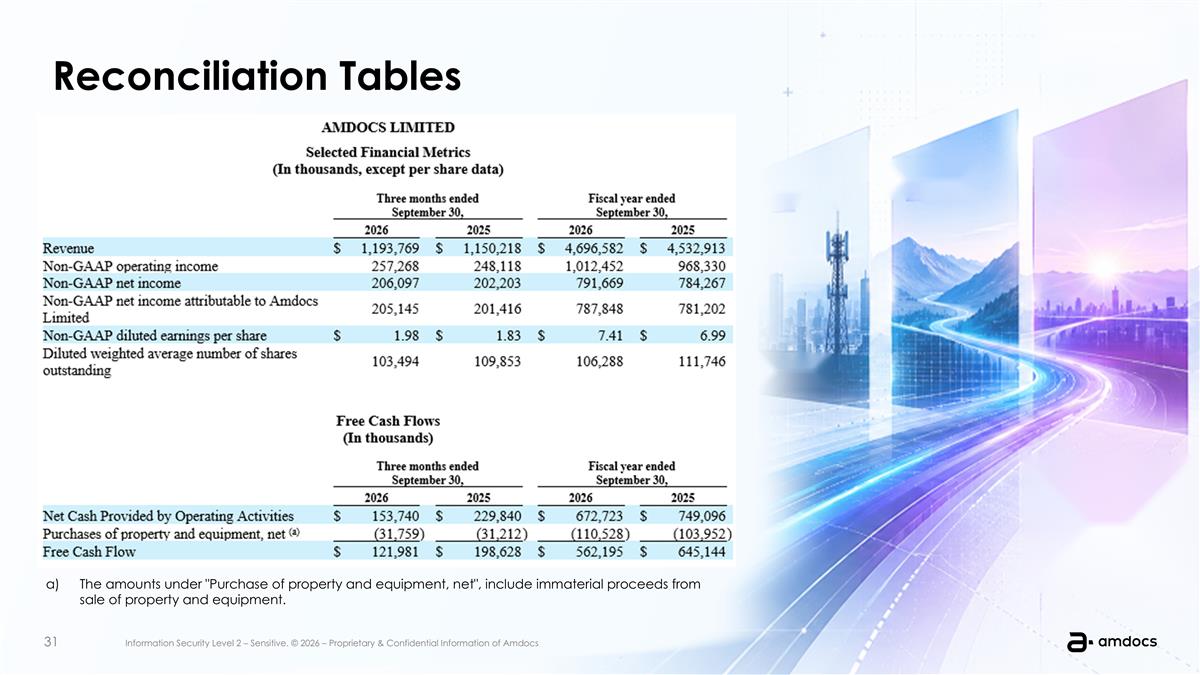
Reconciliation Tables The amounts under "Purchase of property and equipment, net", include immaterial proceeds from sale of property and equipment.
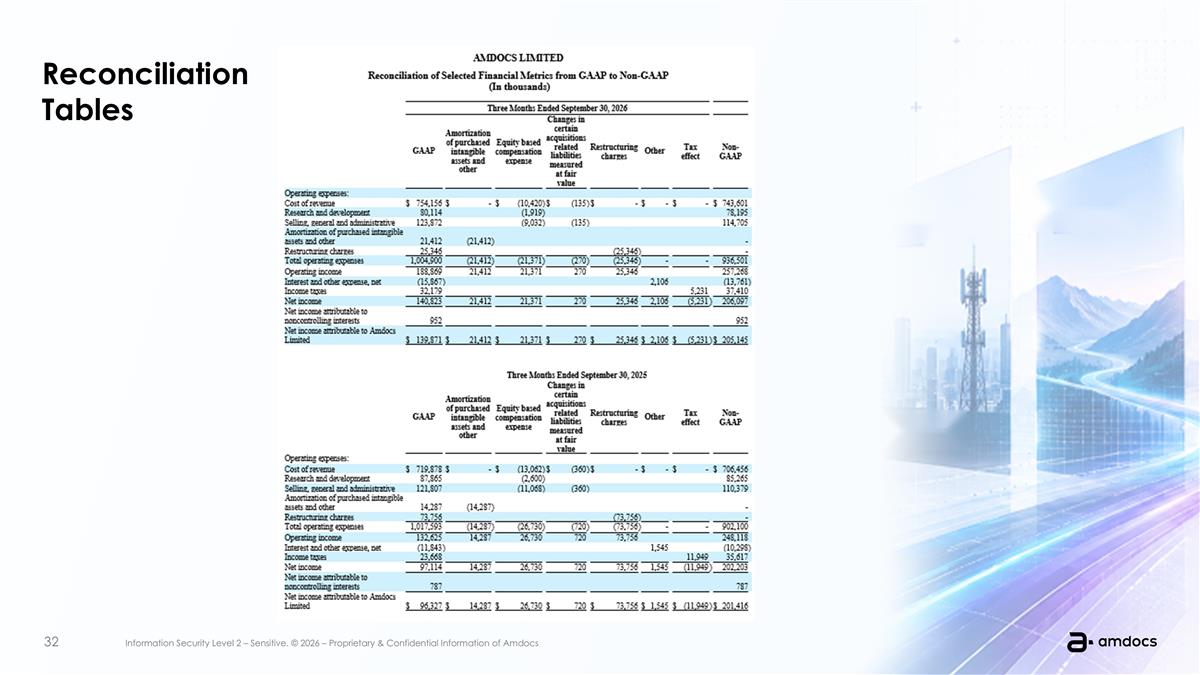
Reconciliation Tables
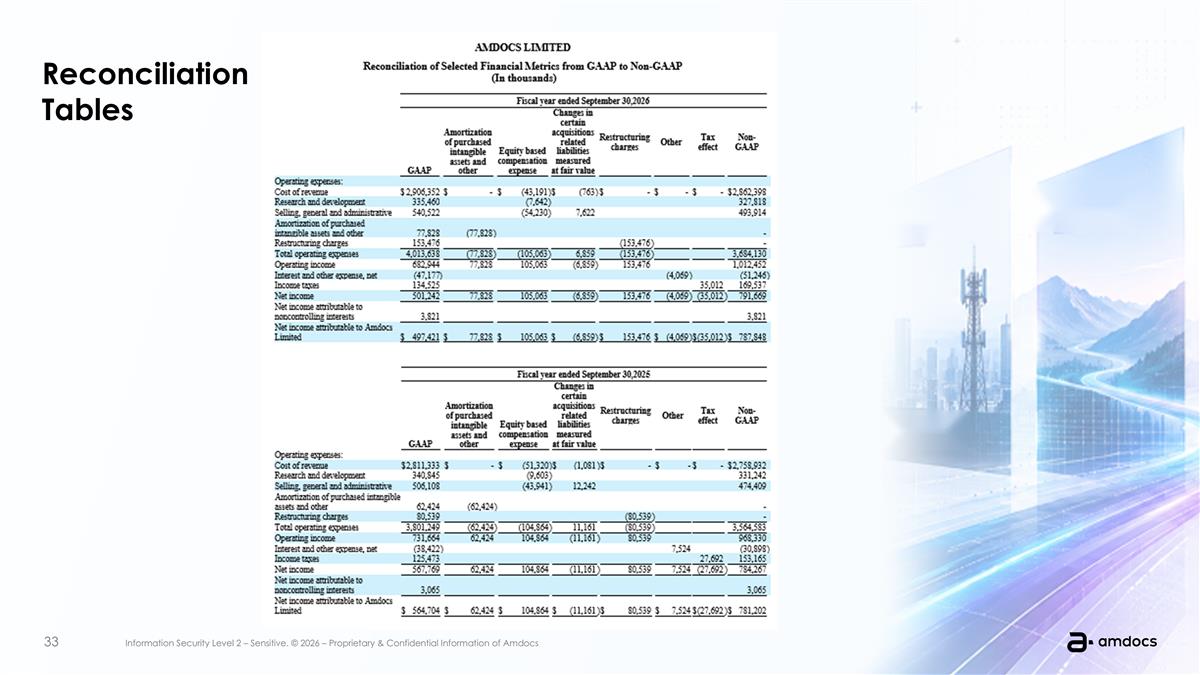
Reconciliation Tables